


Why Did SOLV Energy (MWH) Move And Draw Fresh Attention?
SOLV Energy (MWH) has drawn fresh attention after its recent share performance, with the stock down about 16% year to date but modestly higher over the past month.
For SOLV Energy, momentum has been mixed, with the stock posting a 7 day share price return of 7.2% and edging 1.9% higher over 30 days, yet still down 9.43% over 90 days and 16.04% year to date, which may indicate recovering sentiment following a weaker stretch.
Scan how SOLV Energy compares with other infrastructure focused contractors by running your own filter across the 43 power grid technology and infrastructure stocks in a few minutes.
SOLV Energy looks like a solid infrastructure contractor on paper, and the recent share rebound hints that some investors agree. The real tension now is whether that story is already in the price.
Preferred P/E of 26.7x: Is it justified for SOLV Energy?
SOLV Energy currently trades on a P/E of 26.7x, and at a last close of $25.75 it is flagged as good value versus peers, its industry, and an estimated fair P/E level.
The P/E ratio compares the share price with earnings per share, so for a contractor like SOLV Energy it reflects what investors are willing to pay for each dollar of profit today.
Here, the stock is described as good value on multiple checks. Its 26.7x P/E is below both the US Construction industry average of 32.8x and a peer average of 33.2x. The estimated fair P/E of 30x indicates that the current multiple is lower than that reference level, assuming sentiment and earnings forecasts remain consistent with that estimate.
Explore the SWS fair ratio for SOLV Energy.
Result: Price-to-earnings of 26.7x (UNDERVALUED)
Still, SOLV Energy depends heavily on US power infrastructure spending and project work, so any slowdown in utility scale solar awards could quickly cool expectations.
Find out about the key risks to this SOLV Energy narrative.
Another View on SOLV Energy's Value
The P/E checks suggest SOLV Energy is cheap, but our DCF model also flags the shares as undervalued, with the current $25.75 price sitting below an estimated future cash flow value of $45.11. That is a wide gap. The real question is whether those cash flow assumptions prove resilient.
Look into how the SWS DCF model arrives at its fair value.
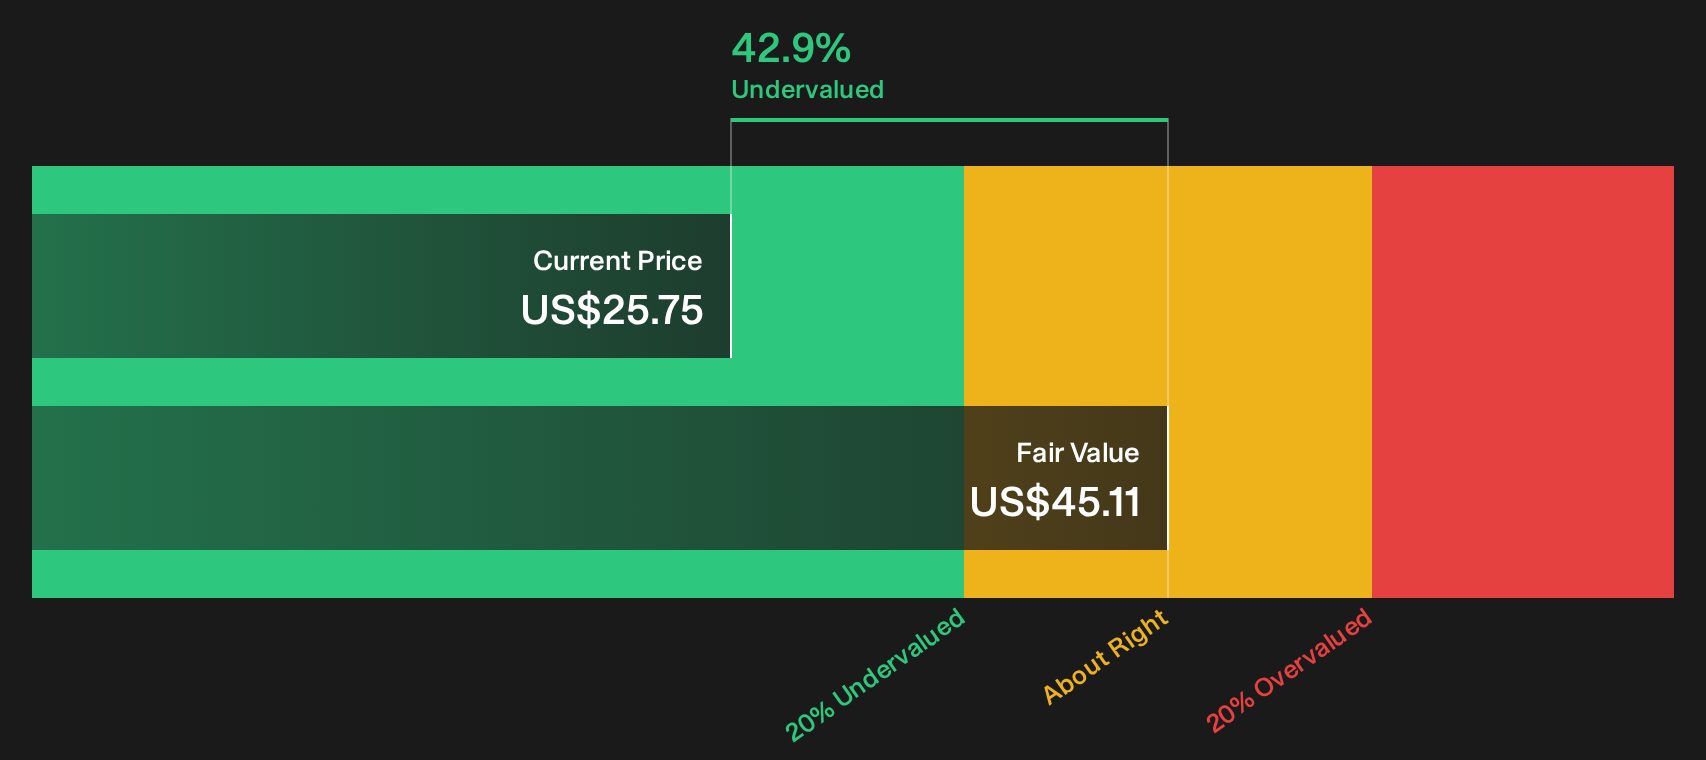
Simply Wall St performs a discounted cash flow (DCF) on every stock in the world every day (check out SOLV Energy for example). We show the entire calculation in full. You can track the result in your watchlist or portfolio and be alerted when this changes, or use our stock screener to discover 29 high quality undervalued stocks. If you save a screener we even alert you when new companies match - so you never miss a potential opportunity.
Next Steps
The data so far paints a fairly optimistic picture around SOLV Energy, so it makes sense to pressure test it yourself before sentiment shifts. To see what the current optimism is grounded in, take a closer look at the 5 key rewards.
Looking for more SOLV Energy style ideas?
If SOLV Energy has your attention, do not stop at a single ticker. Broaden your watchlist with a few focused screens that can surface different types of opportunities.
- Target potential mispricing by scanning companies flagged as 29 high quality undervalued stocks that combine quality fundamentals with prices that may not fully reflect them yet.
- Prioritise resilience by reviewing 31 resilient stocks with low risk scores that score well on financial strength and business stability measures.
- Hunt for early stage potential by checking out 20 high quality undiscovered gems where strong underlying metrics have not attracted wider attention.
This article by Simply Wall St is general in nature. We provide commentary based on historical data and analyst forecasts only using an unbiased methodology and our articles are not intended to be financial advice. It does not constitute a recommendation to buy or sell any stock, and does not take account of your objectives, or your financial situation. We aim to bring you long-term focused analysis driven by fundamental data. Note that our analysis may not factor in the latest price-sensitive company announcements or qualitative material. Simply Wall St has no position in any stocks mentioned.
Have feedback on this article? Concerned about the content? Get in touch with us directly. Alternatively, email editorial-team@simplywallst.com