


Is Reliance (RS) Fairly Valued Following Its October Earnings Date Update?
Reliance (RS) has set its next catalyst. The company plans to release third quarter 2026 results on Wednesday, October 21, after the close, followed by a conference call on October 22.
Recent price action has been choppy, with the share price slipping 1.3% over the last day but still posting a 5.2% 90 day share price return and a 33.9% year to date share price return. The 1 year total shareholder return of 43.0% and 5 year total shareholder return of 196.4% highlight how Reliance has rewarded long term holders even as near term momentum has cooled ahead of the third quarter update.
Scan beyond Reliance's strong multi year return profile and line up other potential metal and materials beneficiaries using the curated list of solid balance sheet and fundamentals (25 results).
For Reliance, the recent pullback comes after a strong multi year run and solid reported earnings growth. Is this latest wobble about the underlying business, or just sentiment resetting the price you are asked to pay?
Most Popular Narrative: 3% Undervalued
The most followed view on Reliance pegs fair value close to the current $396.22 share price, with only a small implied upside based on a $408.88 assessment that uses a 9.05% discount rate and long range earnings forecasts.
Heightened data center construction, public infrastructure work and power grid projects are currently supporting strong non residential construction demand. This demand represents roughly one third of Reliance sales and can continue to feed volumes and support revenue and operating leverage.
See why 6 investors see Reliance as 3% undervalued.
Result: Fair Value of $408.88 (UNDERVALUED)
Still, the Reliance story carries clear pressure points if Section 232 aluminum tariffs keep squeezing gross margin, or if higher LIFO charges keep biting into reported earnings.
Find out about the key risks to this Reliance narrative.
Another View On Reliance Valuation
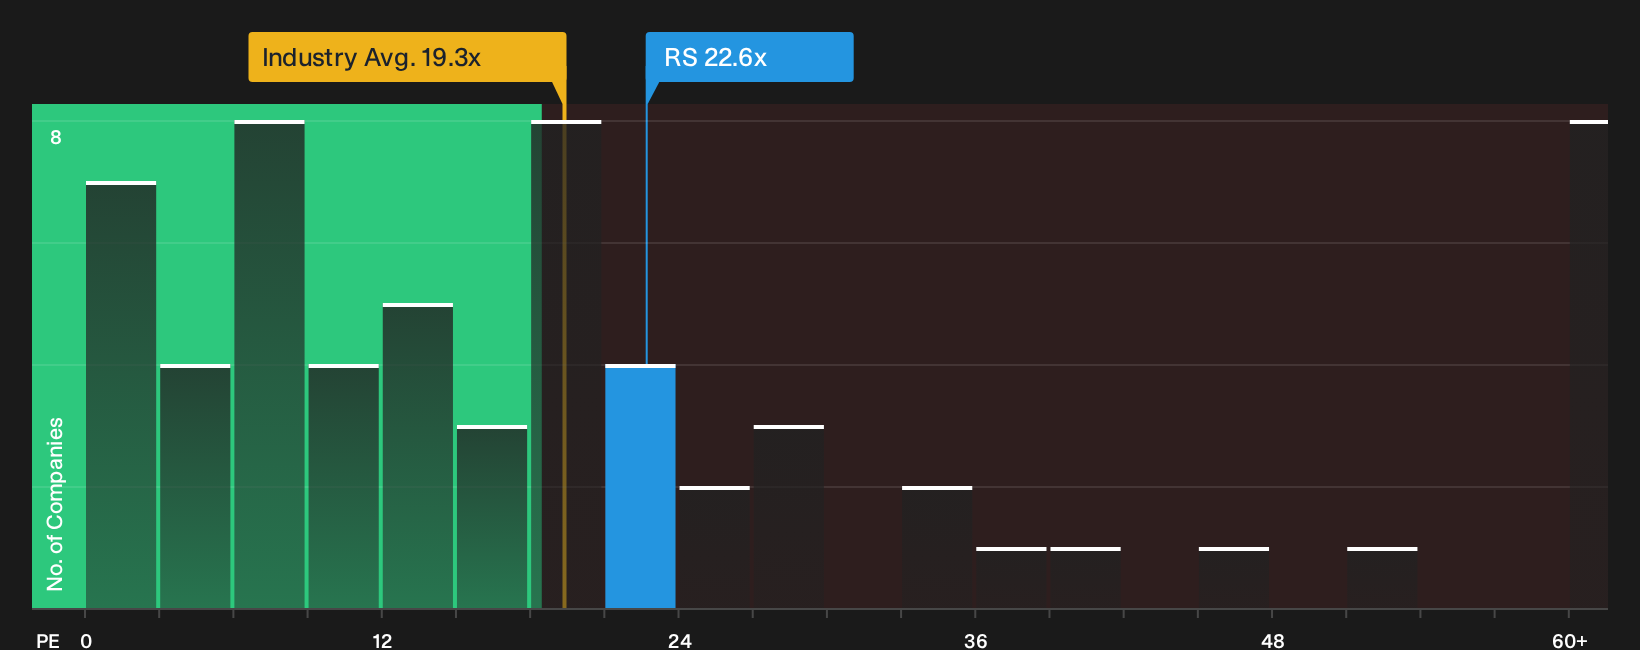
Fair value of $408.88 from long range earnings forecasts paints Reliance as modestly undervalued. The P/E tells a different story. At 22.6x earnings, the stock trades above the US Metals and Mining industry at 19.8x and above its own 18.5x fair ratio, which lifts valuation risk if sentiment cools even slightly.
Investors who lean on earnings multiples rather than discounted cash flow can use that P/E gap to stress test their own comfort with paying up for Reliance at this stage of the cycle, then compare it with how other metals and materials operators are priced using the See what the numbers say about this price — find out in our valuation breakdown..
Next Steps
If the split between optimism and caution around Reliance feels familiar, that is exactly the point. You now need to weigh the trade off yourself using the 1 key reward and 1 important warning sign.
Looking For More Investment Ideas Beyond Reliance?
Do not stop with Reliance. Use the Simply Wall Street Screener to surface fresh opportunities, compare quality, and pressure test where your next dollar really works hardest.
- Target dependable income streams by scanning companies that resemble dividend fortresses through the 8 dividend fortresses.
- Hunt for value where quality and sensible pricing meet using the focused 29 high quality undervalued stocks.
- Prioritize resilience first and sort for sturdier balance sheets and steadier fundamentals with the 31 resilient stocks with low risk scores.
This article by Simply Wall St is general in nature. We provide commentary based on historical data and analyst forecasts only using an unbiased methodology and our articles are not intended to be financial advice. It does not constitute a recommendation to buy or sell any stock, and does not take account of your objectives, or your financial situation. We aim to bring you long-term focused analysis driven by fundamental data. Note that our analysis may not factor in the latest price-sensitive company announcements or qualitative material. Simply Wall St has no position in any stocks mentioned.
Have feedback on this article? Concerned about the content? Get in touch with us directly. Alternatively, email editorial-team@simplywallst.com