


MarineMax (HZO), What Is Drawing Fresh Attention Now?
MarineMax (HZO) has drawn fresh attention after recent share moves, with the price closing at $52.47. Investors are weighing that level against the retailer’s performance, its value score of 3, and its recent return profile.
Recent moves in MarineMax’s share price sit on top of a much stronger run over the past few months, with a 90-day share price return of 50.82% and a 1-year total shareholder return of 105.76%, suggesting that momentum has been building rather than fading.
Seize MarineMax's sharp run as a reference point and line it up against 29 high quality undervalued stocks that combine strong cash flows with balance sheets built to handle tougher conditions.MarineMax now appears to be a stronger operator than its volatile share chart suggests. After this sharp run, is that resilience already baked into the US$52.47 price, or is the valuation still playing catch up?
Most Popular Narrative: 12% Overvalued
MarineMax is trading at $52.47 against a widely followed fair value view of $47.00. The current price sits above that reference point while still being anchored to a detailed set of growth and margin assumptions.
Strong latent demand and industry inventory adjustments position the company for a sharp rebound in sales and margin expansion as economic conditions improve. The persistent popularity of the boating lifestyle evidenced by strong marina usage and high engagement even in a soft sales environment indicates pent-up demand.
See why 7 investors see MarineMax as 12% overvalued.
Result: Fair Value of $47 (OVERVALUED)
Still, MarineMax faces clear pressure points, including elevated industry inventory and structurally thin new boat margins that could keep earnings and valuation assumptions under strain.
Find out about the key risks to this MarineMax narrative.
Another View On MarineMax’s Valuation
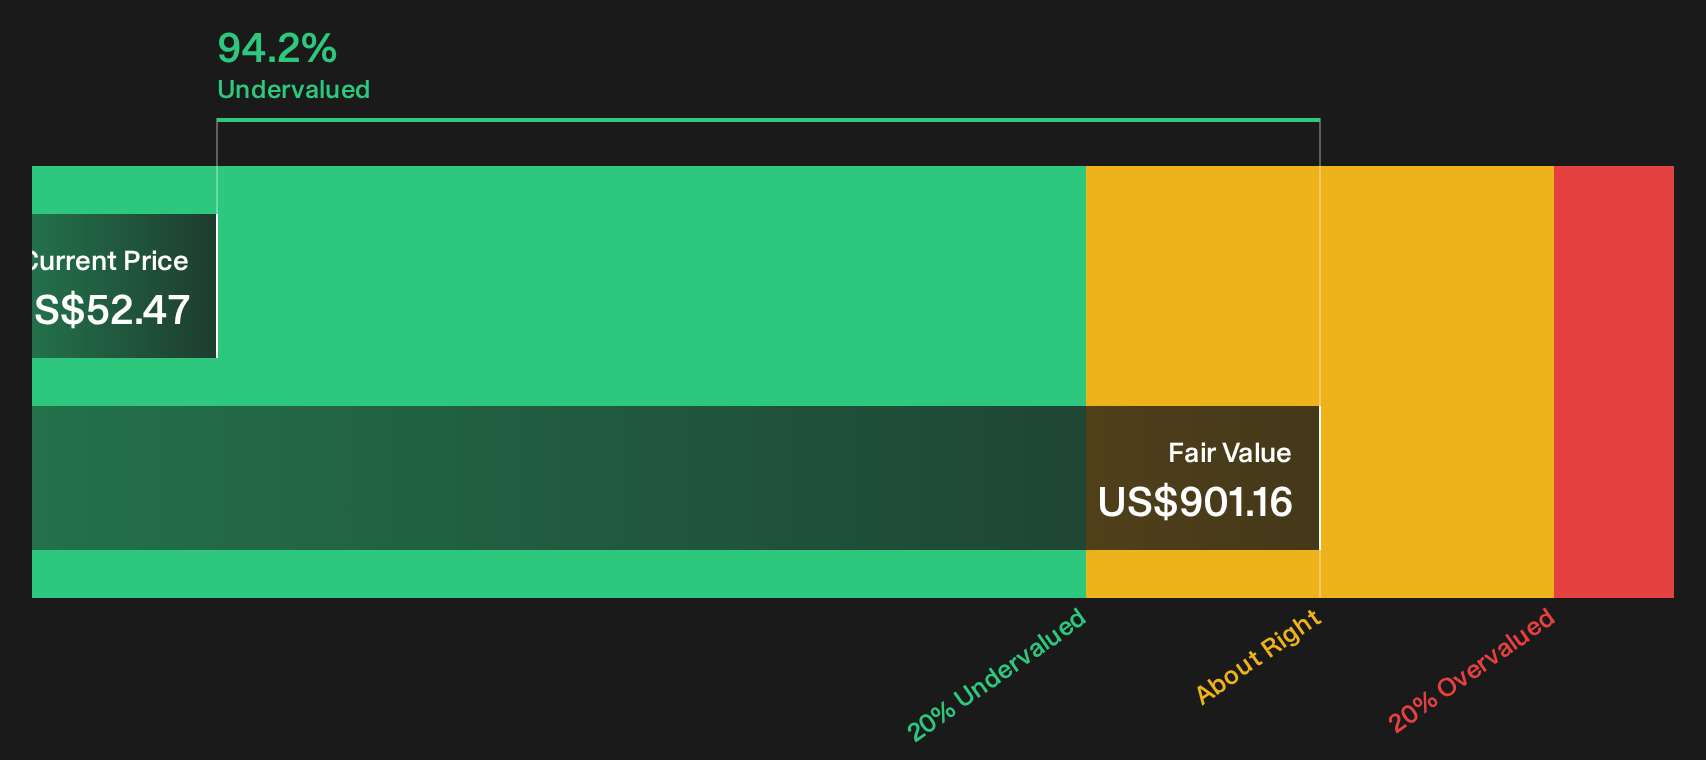
Analysts see MarineMax as roughly 12% above a US$47 fair value, yet our DCF model points the other way and flags the shares as trading at a very large discount to an estimated future cash flow value of US$901.16. Which signal should carry more weight for you?
To understand how that gap is built up and what assumptions sit behind it, take a closer look at the SWS DCF model: Look into how the SWS DCF model arrives at its fair value.
Next Steps
Mixed signals on MarineMax’s value story so far. For a sharper view, move quickly, scrutinize the data, and weigh both sides through 3 key rewards and 3 important warning signs.
Looking for more MarineMax sized opportunities?
Momentum in MarineMax is only one angle. Broaden your watchlist with fresh ideas before the next move gets away from you.
- Target quality at a discount by scanning a focused pool of 29 high quality undervalued stocks that pair solid cash generation with supportive balance sheets.
- Build a sturdier portfolio core and lean on 31 resilient stocks with low risk scores that screen for businesses with more resilient risk profiles.
- Get ahead of the crowd and sort through 20 high quality undiscovered gems that combine strong fundamentals with relatively low investor attention.
This article by Simply Wall St is general in nature. We provide commentary based on historical data and analyst forecasts only using an unbiased methodology and our articles are not intended to be financial advice. It does not constitute a recommendation to buy or sell any stock, and does not take account of your objectives, or your financial situation. We aim to bring you long-term focused analysis driven by fundamental data. Note that our analysis may not factor in the latest price-sensitive company announcements or qualitative material. Simply Wall St has no position in any stocks mentioned.
Have feedback on this article? Concerned about the content? Get in touch with us directly. Alternatively, email editorial-team@simplywallst.com