


What Is Drawing Fresh Attention To TXNM Energy (TXNM)?
TXNM Energy (TXNM) has been drawing attention after its recent rebrand from PNM Resources, shifting the focus squarely to its regulated electricity operations across Texas and New Mexico for income oriented investors.
At a share price of US$58.51, TXNM Energy has delivered a 3.5% 90 day share price return, while its 1 year total shareholder return of 6.0% and 3 year total shareholder return of 47.5% signal momentum that has built gradually rather than in a single jump.
Scan beyond TXNM Energy and line up other regulated utilities with steady share price momentum using our curated list of 31 resilient stocks with low risk scores.
The recent rebrand and steady share gains put TXNM Energy only a few dollars below the average analyst estimate. Does that gap signal limited upside, or a mispriced regulated utility story heading into valuation work next?
Price-to-Earnings of 32.9x: Is it justified for TXNM Energy?
TXNM Energy trades on a P/E of 32.9x, which is rich compared with both the US Electric Utilities industry and its peer group, and the share price near $58.51 reflects that premium.
The P/E ratio compares what investors are paying today for each dollar of current earnings. For regulated utilities like TXNM Energy, this measure often captures how much confidence the market has in the stability and predictability of those profits.
TXNM Energy delivered earnings growth of 10.4% over the past year, ahead of its 5 year trend where earnings have declined by 2.5% per year. That improvement, together with high quality earnings and slightly higher profit margins of 8.8% versus 8.7% last year, helps explain why investors might be willing to pay a higher multiple even though Return on Equity of 5.9% is described as low and revenue growth of 8.1% per year is forecast below the broader US market.
The valuation premium is clear. TXNM Energy's P/E of 32.9x is described as expensive relative to both the US Electric Utilities industry average of 20x and the peer average of 20.6x, which signals that the market is pricing in a much stronger or more dependable earnings profile than those benchmarks.
See what the numbers say about this price — find out in our valuation breakdown.
Result: Price-to-earnings of 32.9x (OVERVALUED).
Still, the premium story around TXNM Energy can quickly unravel if regulators squeeze allowed returns or if forecast revenue growth of about 8.1% falls short.
Find out about the key risks to this TXNM Energy narrative.
Another View On TXNM Energy’s Valuation
The high P/E story for TXNM Energy meets a very different read when you look at our DCF model. On this approach, the share price of $58.51 sits above an estimated future cash flow value of $28.63, which points to an overvalued signal rather than a simple quality premium.
The gap between those two numbers raises a practical question for you as an investor. Is the market fairly rewarding TXNM Energy for perceived resilience, or is it paying upfront for cash flows that the underlying regulated business may not fully deliver?
Look into how the SWS DCF model arrives at its fair value.
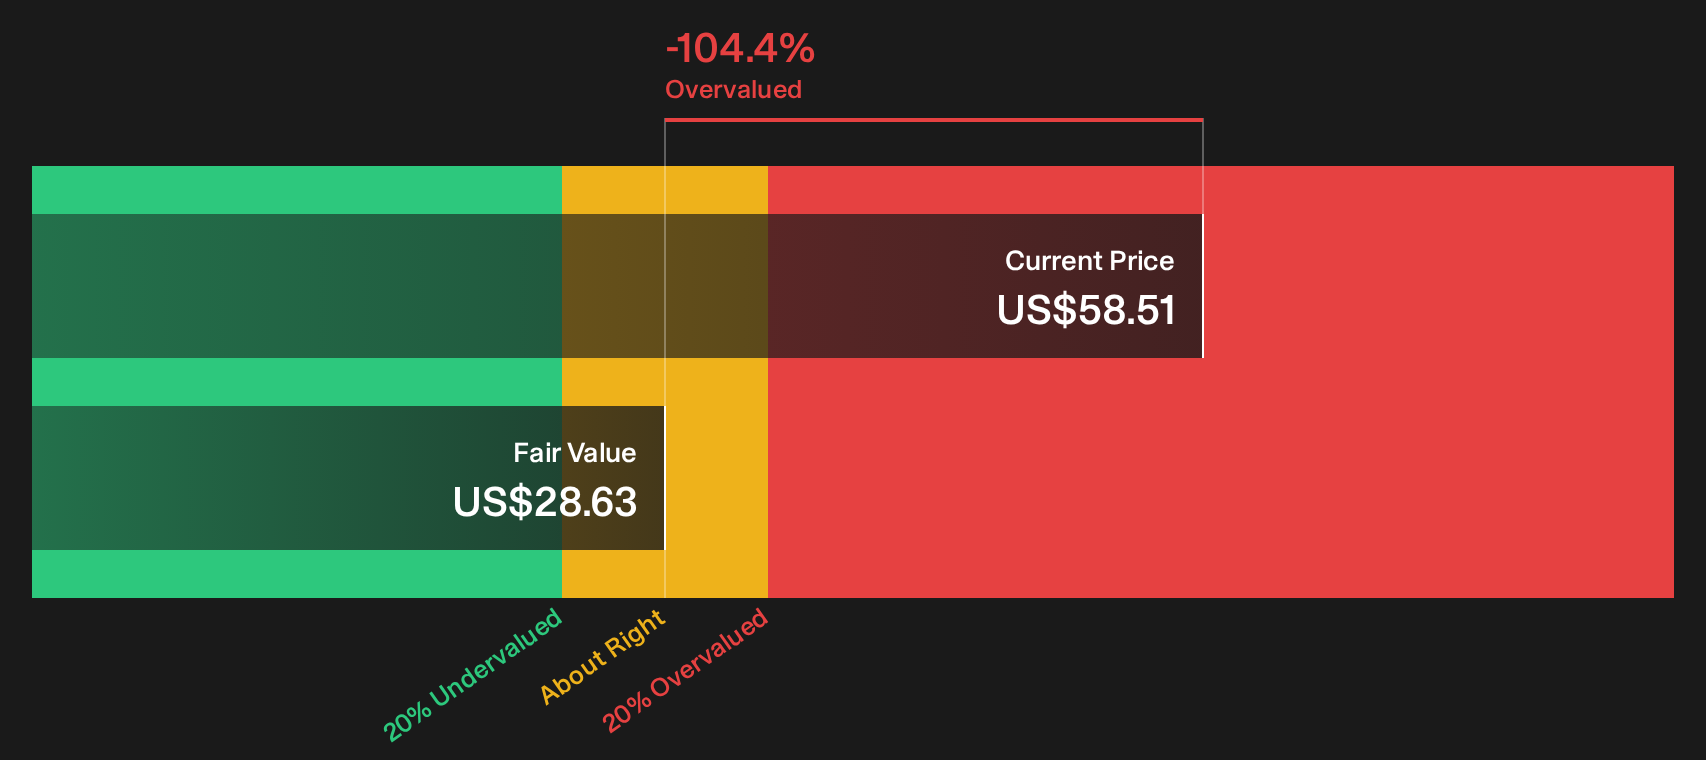
Simply Wall St performs a discounted cash flow (DCF) on every stock in the world every day (check out TXNM Energy for example). We show the entire calculation in full. You can track the result in your watchlist or portfolio and be alerted when this changes, or use our stock screener to discover 29 high quality undervalued stocks. If you save a screener we even alert you when new companies match - so you never miss a potential opportunity.
Next Steps
Mixed signals on TXNM Energy's valuation and growth story can feel unresolved, so review the underlying data quickly and weigh both sides using the 1 key reward and 3 important warning signs.
Looking for more TXNM Energy style investment ideas?
If TXNM Energy's setup has you thinking harder about pricing, cash flows, and stability, broaden your watchlist using focused screeners that surface clear, data driven ideas.
- Target potential value opportunities before the crowd notices by scanning our hand picked set of 20 high quality undiscovered gems.
- Strengthen the defensive side of your portfolio by reviewing a curated list of solid balance sheet and fundamentals (25 results).
- Build a more dependable income stream by checking companies in the 8 dividend fortresses.
This article by Simply Wall St is general in nature. We provide commentary based on historical data and analyst forecasts only using an unbiased methodology and our articles are not intended to be financial advice. It does not constitute a recommendation to buy or sell any stock, and does not take account of your objectives, or your financial situation. We aim to bring you long-term focused analysis driven by fundamental data. Note that our analysis may not factor in the latest price-sensitive company announcements or qualitative material. Simply Wall St has no position in any stocks mentioned.
Have feedback on this article? Concerned about the content? Get in touch with us directly. Alternatively, email editorial-team@simplywallst.com