


Bruker (BRKR) Unveils New Proteomics Tools, Is The Stock Fully Priced?
Bruker (BRKR) just introduced new mass spectrometry and AI workflows for proteomics and nucleic acid research, and also received a multi system high field NMR order from UC Berkeley valued at more than US$6 million.
Bruker’s new proteomics and NMR announcements come after a strong run, with a 30 day share price return of 8.10% contributing to a 31.45% year to date gain and a 1 year total shareholder return of 74.19%. This suggests momentum has been building even as the 5 year total shareholder return declined 15.57%.
Scan for other research-focused plays showing similar momentum and product depth by reviewing the hand picked 33 healthcare AI stocks alongside Bruker’s latest AI and proteomics rollout.
Bruker’s tools look powerful and the recent share price run has been steep. The real question now is whether you are paying a fair price for that strength or stretching on valuation.
Most Popular Narrative: 1.6% Overvalued
Bruker closed at $63.24 compared with a narrative fair value of $62.25, so the current price roughly matches what the prevailing thesis expects from the business using an 8.49% discount rate.
The mix shift toward diagnostics, recurring aftermarket and software, where aftermarket now accounts for about 40% of Bruker revenue versus roughly 25% nine years ago and is targeted to move toward 50%, is gradually increasing the share of more predictable income streams and has the potential to support steadier revenue growth and more stable net margins over time.
See why 17 investors see Bruker as 2% overvalued.
Result: Fair Value of $62.25 (ABOUT RIGHT)
Still, Bruker’s thesis hinges on funding holding up, and on loss-making automation and spatial biology not dragging on margins and earnings longer than expected.
Find out about the key risks to this Bruker narrative.
Another View On Bruker’s Valuation
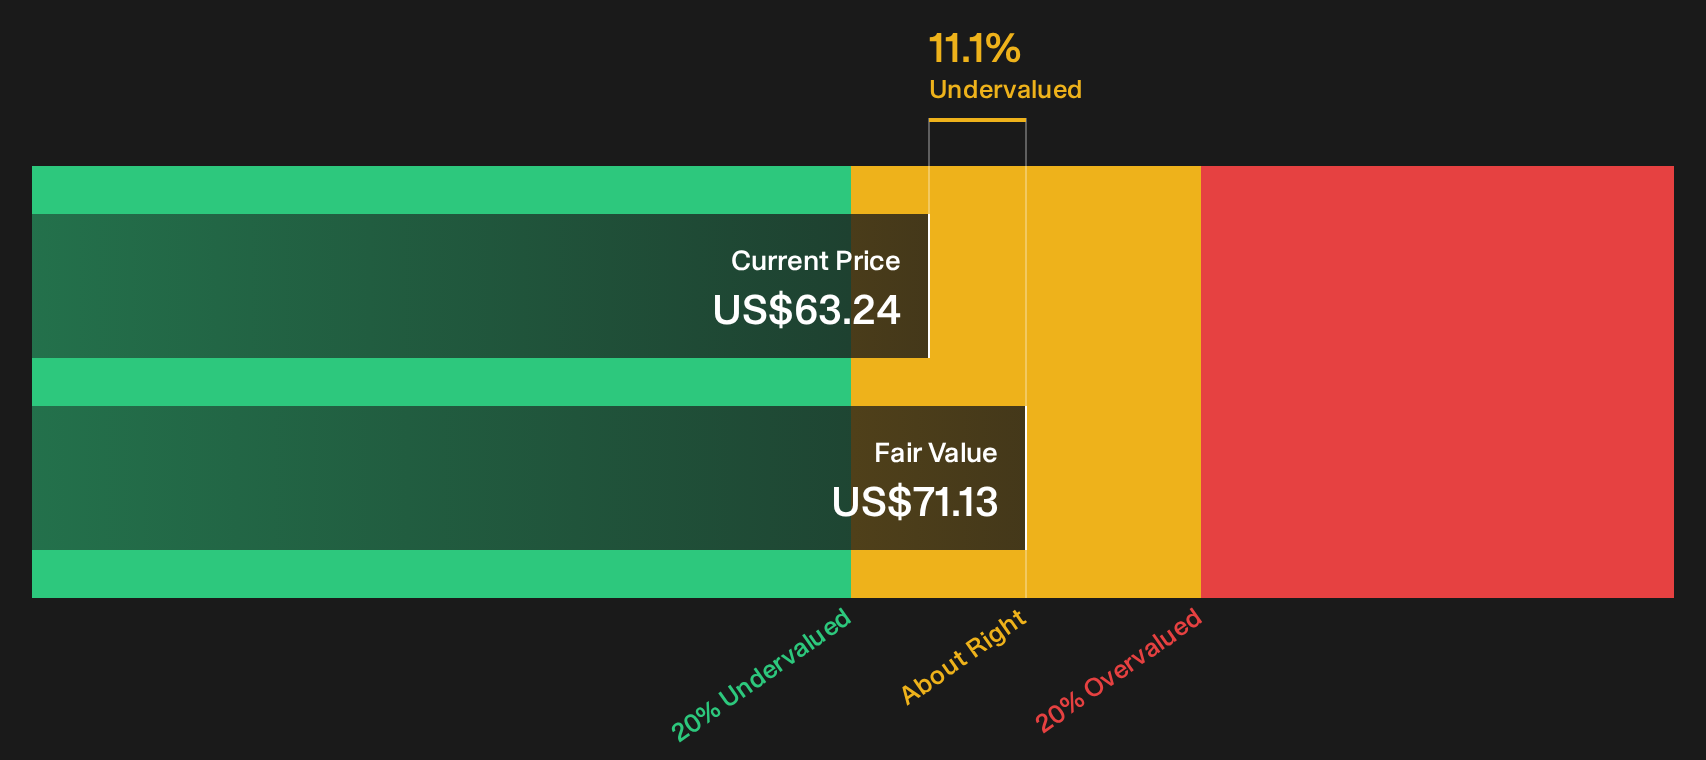
While the analyst narrative pins Bruker close to fair value at $62.25, the SWS DCF model tells a different story, with an estimated future cash flow value of $71.13. That points to the current $63.24 price sitting below this fair value line. Which benchmark do you treat as your anchor?
To understand how this cash flow based view is built and stress test the moving parts, take a closer look at the Look into how the SWS DCF model arrives at its fair value.
Next Steps
Does Bruker’s setup feel balanced between promise and pressure to you, or skewed one way? Act quickly on that instinct, then test it against the detailed breakdown of 3 key rewards and 1 important warning sign.
Looking for more Bruker sized investment ideas?
If your thesis on Bruker is nearly set, broaden your watchlist now with a few targeted screens that surface clear, data driven opportunities you might otherwise miss.
- Target resilient compounding potential by reviewing the 31 high quality undervalued stocks to find ideas that pair quality fundamentals with prices that still leave room for upside.
- Find income focused candidates through the 7 dividend fortresses to identify higher yields backed by robust underlying businesses.
- Protect your downside with the 31 resilient stocks with low risk scores to highlight companies scoring well on balance sheet strength and risk checks.
This article by Simply Wall St is general in nature. We provide commentary based on historical data and analyst forecasts only using an unbiased methodology and our articles are not intended to be financial advice. It does not constitute a recommendation to buy or sell any stock, and does not take account of your objectives, or your financial situation. We aim to bring you long-term focused analysis driven by fundamental data. Note that our analysis may not factor in the latest price-sensitive company announcements or qualitative material. Simply Wall St has no position in any stocks mentioned.
Have feedback on this article? Concerned about the content? Get in touch with us directly. Alternatively, email editorial-team@simplywallst.com