


Grain Markets Send Mixed Signals
Tim Healy 10/5/2026
If you would like to receive more information on the commodity markets or would like to open an account, please give me a call or click the link below.
Corn Dec '26 (ZCZ26)
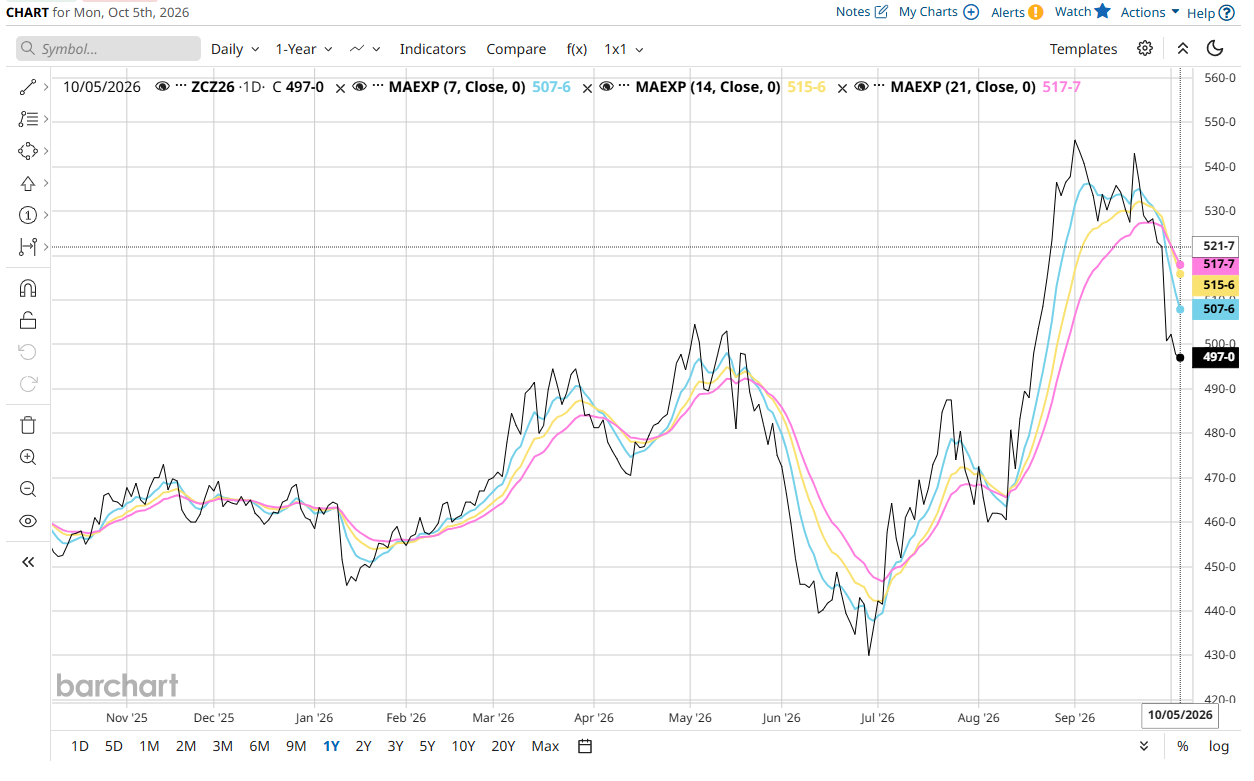
December 2026 Corn Technicals
Current Price: 500'6
7DMA: 510'5
14DMA: 521'5
21DMA: 525'4
Bearish moving-average structure
The averages are aligned:
7-day MA below 14-day MA below 21-day MA
That is a clearly bearish short-term structure. It indicates that recent prices are weakening faster than the broader three-week trend.
The current price is:
9’7 below the 7-day average
20’7 below the 14-day average
24’5 below the 21-day average
Price being below all three averages confirms that sellers currently control the short-term trend.
Momentum in December corn declined from 536’6 on September 22 to approximately 500’6 on October 5. It is also down about 21’2, or 4.1%, over the latest five trading sessions.
The sharp September 30th decline from 522’0 to 500’6, accompanied by the highest volume in the recent data, represents a meaningful downside momentum break rather than an ordinary low-volume pullback.
Key technical levels
Immediate support: 495’0
Psychological support: 500’0
First resistance: 510’5, the 7-day MA
Secondary resistance: 521’5 to 525’4, the 14-day and 21-day MA zone
Stronger resistance: 527’0 to 530’0, the prior consolidation area.
Current bearish technicals.
The most likely near-term pattern is continued pressure or sideways consolidation below the falling moving averages. A recovery above 510’5 would be the first sign that downside momentum is easing, but the structure would remain bearish until price can reclaim the 521’5 to 525’4 area. A sustained break below 495’0 would reinforce the downtrend and expose lower support.
Soybean Nov '26 (ZSX26)
November 2026 Soybean Technicals
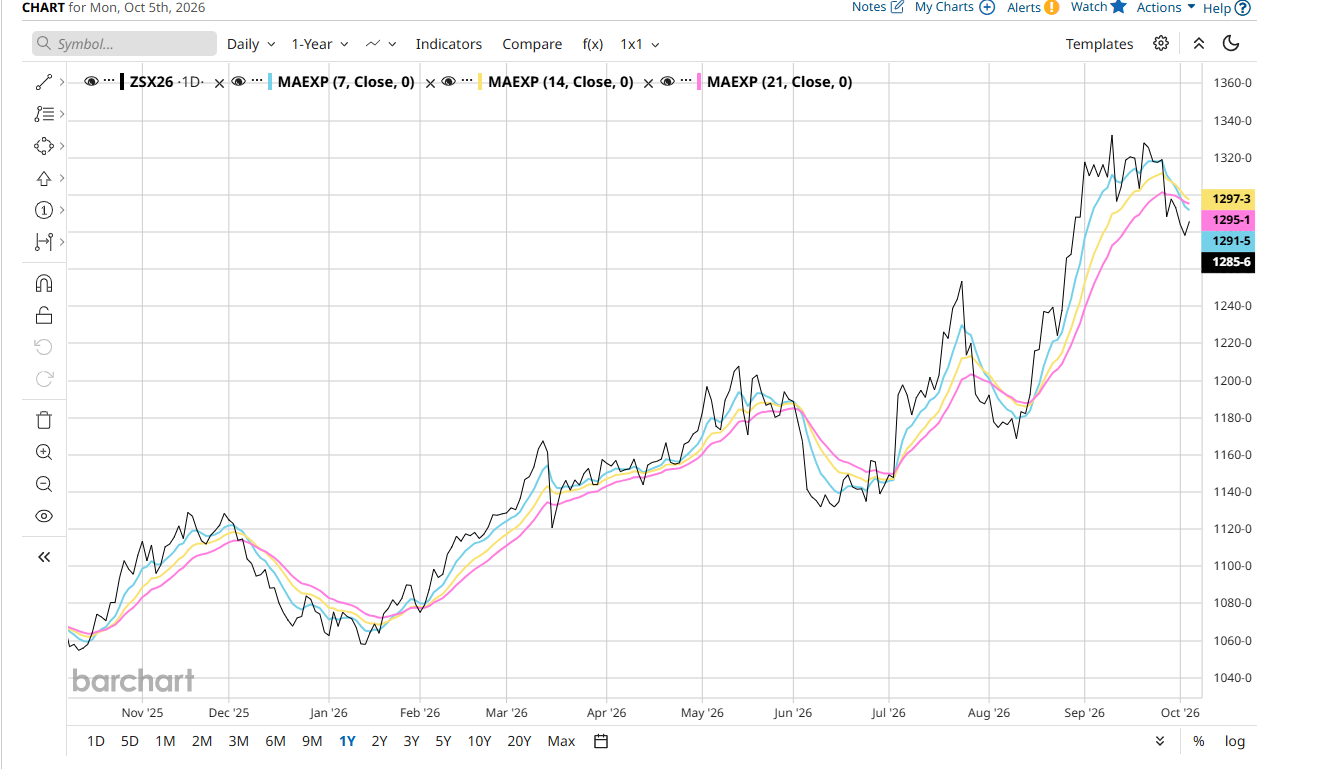
Current Price: 1293'6
7DMA: 1293'1
14DMA: 1307'421DMA: 1308'5
Bullish short-term, Neutral-to-Bearish intermediate trend
Current price (1293'6) is slightly above the 7-day MA (1293'1).
Current price remains below the 14-day MA (1307'4) and below the 21-day MA (1308'5).
This suggests a recent rebound, but soybeans have not yet fully reversed the late-September selloff.
7-day MA: 1293'1
14-day MA: 1307'4
21-day MA: 1308'5
The 7-day average is still below both longer-term averages, which indicates the larger trend remains corrective. However, the gap between the 14-day and 21-day averages has become very small, suggesting downside momentum is slowing. The market sold off sharply from 1328'0 on September 21 to 1278'2 on October 2 but has since rebounded to approximately 1293'6.
Today's rally pushed futures back above the 7-day average, which is the first constructive technical signal since the late-September break.
Key Levels
Immediate Support: 1273-1278
Secondary Support 1288'2
First Resistance 1307'4
Second Resistance 1308'5
Major Resistance: 1318-1328
Neutral technicals with improving momentum.
Bullish: Close above 1308'5 would put price back above both the 14- and 21-day moving averages and indicate a trend reversal.
Neutral: Trade between 1278 and 1308 keeps the market range bound.
Bearish: A break back below 1278 would suggest the recent bounce has failed and could open the door to a retest of lower.
Wheat Dec ’26 (ZWZ26)
Short-Term Trending neutral to bullish short-term.
Current price (694'6) is above the 7-day MA (688'0).
Current price remains below the 14-day MA (703'0).
Current price remains below the 21-day MA (718'1).
This indicates that wheat has staged a recovery from the late-September lows but has not yet reversed the broader downtrend.
7-day MA: 688'0
14-day MA: 703'0
21-day MA: 718'1
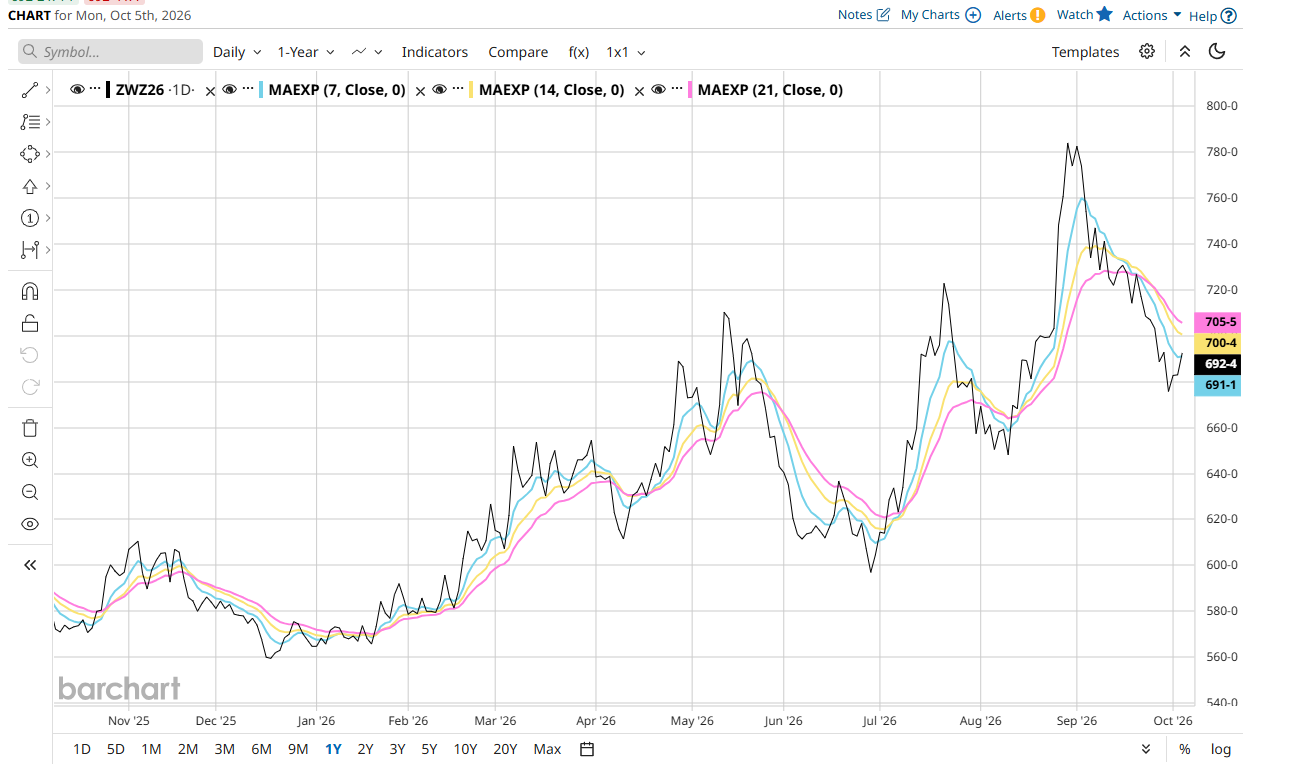
The averages remain aligned in a bearish order:
7-day < 14-day < 21-day
This confirms the larger trend is still down, although today's rally pushed prices above the shortest-term average.
Wheat fell from 726'6 on September 21 to 675'6 on September 30, then rebounded to 694'6 on October 5. The strong move higher on October 5 is the first indication that downside momentum may be slowing. However, bulls still need a close above the 14-day average to confirm a meaningful trend change.
Immediate Support: 680-683
Secondary Support 675'6
First Resistance 703'0
Second Resistance 718'1
Major Resistance: 726-731
Technical Bias: Neutral-Bearish, Improving
Bullish scenario I believe if we hold above 688'0 and break through 703'0.
A move above 718'1 could signal a stronger trend reversal.
Neutral trade between 683'0 and 703'0 as the market consolidates.
Possible bearish if we see failure below 688'0 followed by a break under 675'6 and would put the broader downtrend back in control.
Trade Recommendations Dec ’26 Corn
Sell rallies in corn
Entry Zone: 507-513
Stop: 522
Target 1: 490
Target 2: 475
The 7-day average near 510 is acting as first resistance. Unless corn can reclaim and hold above the 14-day average around 523, the path of least resistance remains lower. Risk/reward favors selling strength rather than chasing weakness.
Bullish signal if we close over 523’0.
Neutral trend to Slightly Bearish
Price is essentially sitting on the 7-day average.
14-day and 21-day averages remain overhead.
Beans have been consolidating rather than trending aggressively.
Trade Recommendation Nov’26 Beans
Buy breakout strength
Entry: Above 1300-1302
Stop: 1283
Target 1: 1320
Target 2: 1340
Soybeans are the strongest chart of the three markets. They are much closer to the moving averages than either corn or wheat. A breakout through the recent consolidation could force short covering and create momentum toward the September highs.
Bearish trigger: Close below 1275.
Trade Recommendation Dec’26 Wheat
Longer term bearish, Improving Short-Term
Price has recovered above the 7-day average.
Still below the 14-day and 21-day averages.
Today's rally may be the first sign of a countertrend recovery.
Buy a pullback
Entry Zone: 688-692
Stop: 679
Target 1: 706
Target 2: 720
Unlike corn, wheat has already reclaimed the 7-day moving average. If momentum continues, a test of the 14-day average around 706 becomes likely. Risk/reward currently favors a tactical long trade rather than initiating new shorts after the recent decline.
Bearish trigger: Close back below 685.

Tim Healy
Broker
Pure Hedge Division
Direct: 312 957 4731
WALSH TRADING INC.
311 S. Wacker Suite 540
Chicago, Illinois 60606
Walsh Trading, Inc. is registered as a Guaranteed Introducing Broker with the Commodity Futures Trading Commission and an NFA Member.
Futures and options trading involves substantial risk and is not suitable for all investors. Therefore, individuals should carefully consider their financial condition in deciding whether to trade. Option traders should be aware that the exercise of a long option will result in a futures position. The valuation of futures and options may fluctuate, and as a result, clients may lose
more than their original investment. The information contained on this site is the opinion of the writer or was obtained from sources cited within the commentary. The impact on market prices due to seasonal or market cycles and current news events may already be reflected in market prices. PAST PERFORMANCE IS NOT NECESSARILY INDICATIVE OF FUTURE RESULTS.
All information, communications, publications, and reports, including this specific material, used and distributed by Walsh Trading, Inc. (“WTI”) shall be construed as a solicitation for entering into a derivatives transaction. WTI does not distribute research reports, employ research analysts, or maintain a research department as defined in CFTC Regulation 1.71.