


Did Weaker Earnings Just Shift THOR Industries' (THO) Investment Narrative?
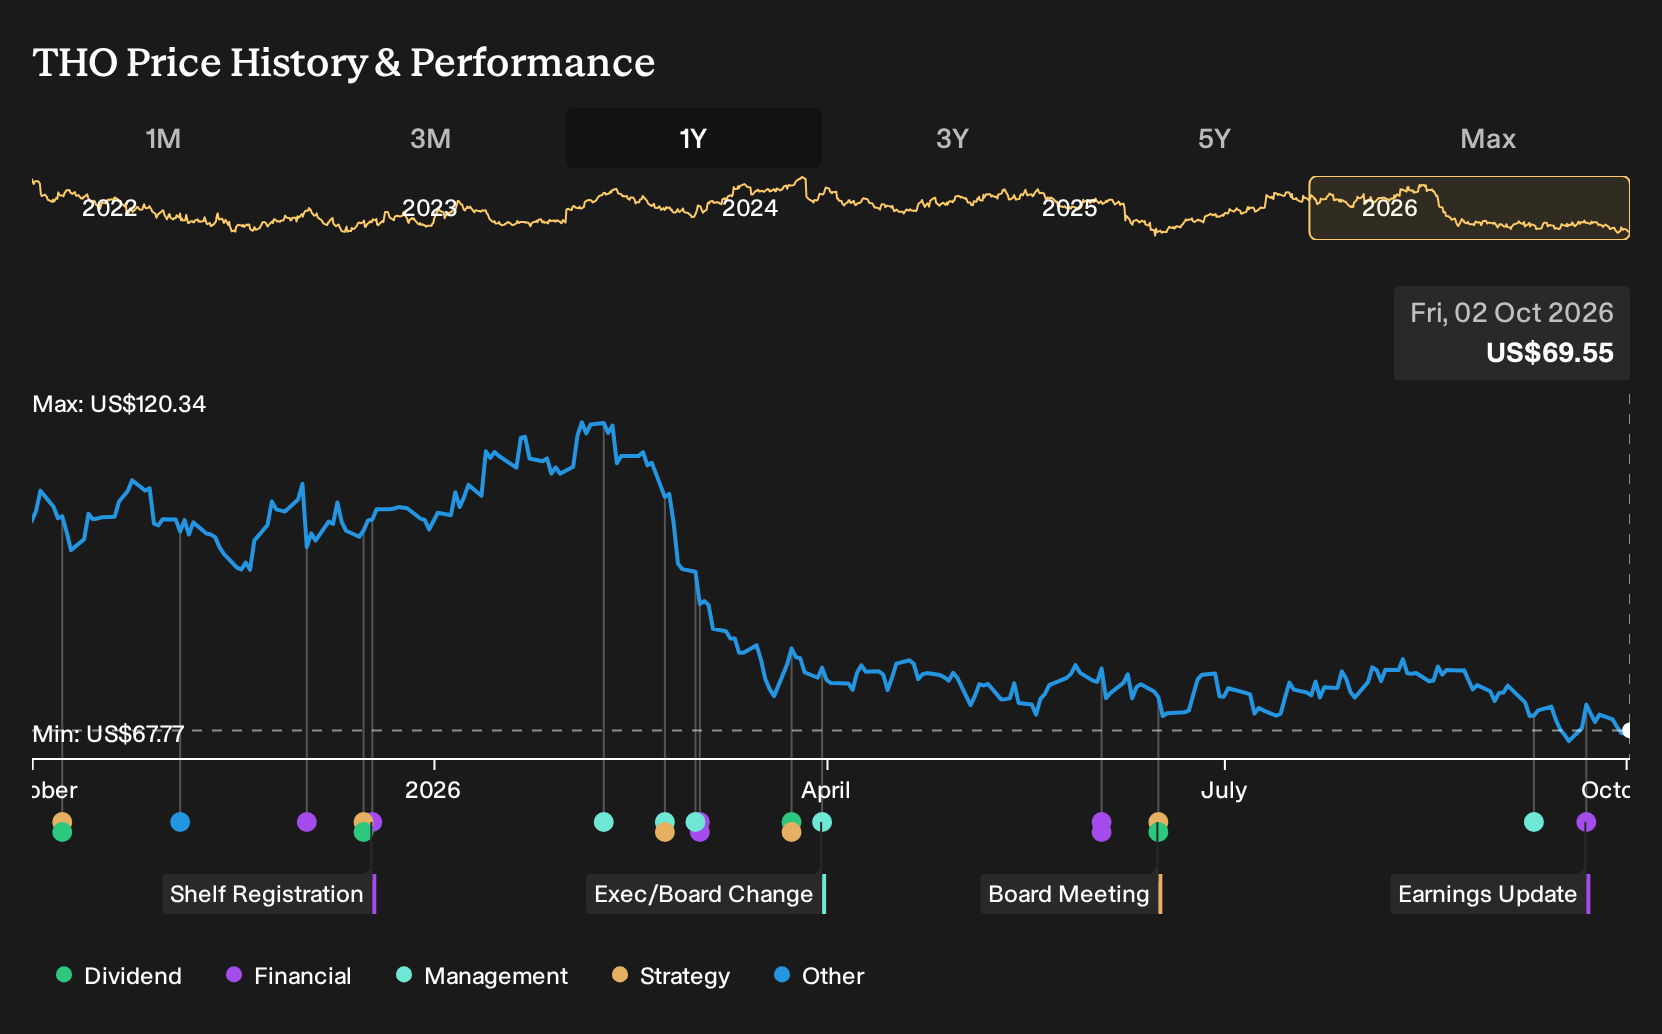
- THOR Industries reported fourth quarter sales of US$2,311.63 million and net income of US$40.84 million, with basic earnings per share from continuing operations of US$0.79, alongside full year sales of US$9,608.15 million and net income of US$177.54 million for the period ended July 31, 2026.
- The company completed a share repurchase program announced in June 2025, retiring 1,504,304 shares for US$135.82 million, while profitability trended lower relative to the prior year.
- Next, the focus turns to how THOR Industries' weaker earnings per share profile may influence the broader investment narrative around the business.
What Is THOR Industries' Investment Narrative?
To stay invested in THOR Industries, you have to buy into a simple idea. This is an RV manufacturer that lives or dies on its ability to match production to a very cyclical level of demand while keeping capital heavy plants running efficiently. The latest quarter shows that story under pressure. Sales for the period were slightly lower than a year ago and earnings per share compressed, which points to softer pricing power or less efficient utilization in parts of the business.
The full year picture is more stable on revenue, yet profit of US$177.54 million on US$9.61b of sales leaves slim margins at a time when THOR Industries is still committing cash to buybacks and dividends. The completed US$135.82 million repurchase reduces the share count, but in the near term the key questions remain around execution, cost control and how quickly demand can support better profitability without requiring another round of heavy reinvestment.
That said, there is one pressure point in the THOR Industries story that is easy to underplay until you look closely at ...
There's only one way to know the right time to buy, sell or hold THOR Industries. Head to Simply Wall St's company report for the latest analysis of THOR Industries's Fair Value.
Exploring Other Perspectives
Three fair value estimates from the Simply Wall St Community range widely, from about US$28 per share up to roughly US$84. That spread shows how far apart private investors can be on THOR Industries after the recent earnings update and completed buyback. Treat this as a starting point and compare several viewpoints before forming a view.
Explore 2 other THOR Industries fair value estimates, including one that suggests as much as 60% downside from the current price!
Form Your Own Verdict
Don't just follow the ticker; dig into the data and build a conviction that's truly your own.
- A great starting point for your THOR Industries research is our analysis highlighting 2 key rewards and 1 important warning sign that could impact your investment decision.
- See our latest analysis for THOR Industries. The report includes a comprehensive fundamental analysis summarized in a single visual, the Snowflake, making it easy to evaluate THOR Industries' overall financial health at a glance.
Looking For More Investment Ideas Beyond THOR Industries?
If the latest update from THOR Industries has you rethinking where to allocate capital next, it can help to widen the lens and scan for businesses with different risk and return profiles using the Simply Wall St Screener.
- If you want potential value with quality fundamentals, check out 31 high quality undervalued stocks which could offer a more appealing balance between price and financial strength.
- If capital preservation is a priority, review 31 resilient stocks with low risk scores which score well on resilience and more measured volatility.
- If you are hunting for mispriced opportunities off the beaten path, scan 19 high quality undiscovered gems which combine strong fundamentals with lower investor attention.
This article by Simply Wall St is general in nature. We provide commentary based on historical data and analyst forecasts only using an unbiased methodology and our articles are not intended to be financial advice. It does not constitute a recommendation to buy or sell any stock, and does not take account of your objectives, or your financial situation. We aim to bring you long-term focused analysis driven by fundamental data. Note that our analysis may not factor in the latest price-sensitive company announcements or qualitative material. Simply Wall St has no position in any stocks mentioned.
Have feedback on this article? Concerned about the content? Get in touch with us directly. Alternatively, email editorial-team@simplywallst.com