


Stagwell (STGW) Tests Its Digital Growth Narrative As Valuation Questions Linger
Stagwell (STGW) is drawing investor attention after fresh company data highlighted its mix of marketing, media, and digital transformation services, prompting a closer look at how its diversified revenue base might influence sentiment.
Stagwell’s share price has cooled in the past month, with a 30-day share price return down 5.05%. However, the year-to-date share price return of 76.74% and 1-year total shareholder return of 53.11% still point to strong momentum building off earlier gains.
Spot emerging peers to Stagwell by scanning our handpicked 19 high quality undiscovered gems that combine strong fundamentals with under-the-radar profiles.The recent pullback sits against strong 1-year and 3-year gains, which raises a simple fork in the road for Stagwell. Are you looking at a business catching up to its price, or a mood swing in the market that got ahead of itself and is now resetting where the valuation sits?
Most Popular Narrative: 14% Undervalued
Stagwell closed at $8.36, while the most followed narrative pegs fair value at $9.71 using an 8.21% discount rate. This frames today’s pullback as a valuation gap rather than a completed reprice.
Expansion and integration of proprietary digital and martech platforms (such as Code and Ink, and the "machine") are creating higher-margin, recurring revenue streams and improving operational efficiencies, which should drive net margin expansion.
See why 6 investors see Stagwell as 14% undervalued.
Result: Fair Value of $9.71 (UNDERVALUED)
Still, the Stagwell narrative can crack if large tech clients cut budgets or if recent acquisitions prove harder to integrate and stall margin progress.
Find out about the key risks to this Stagwell narrative.
Another View On Stagwell’s Valuation
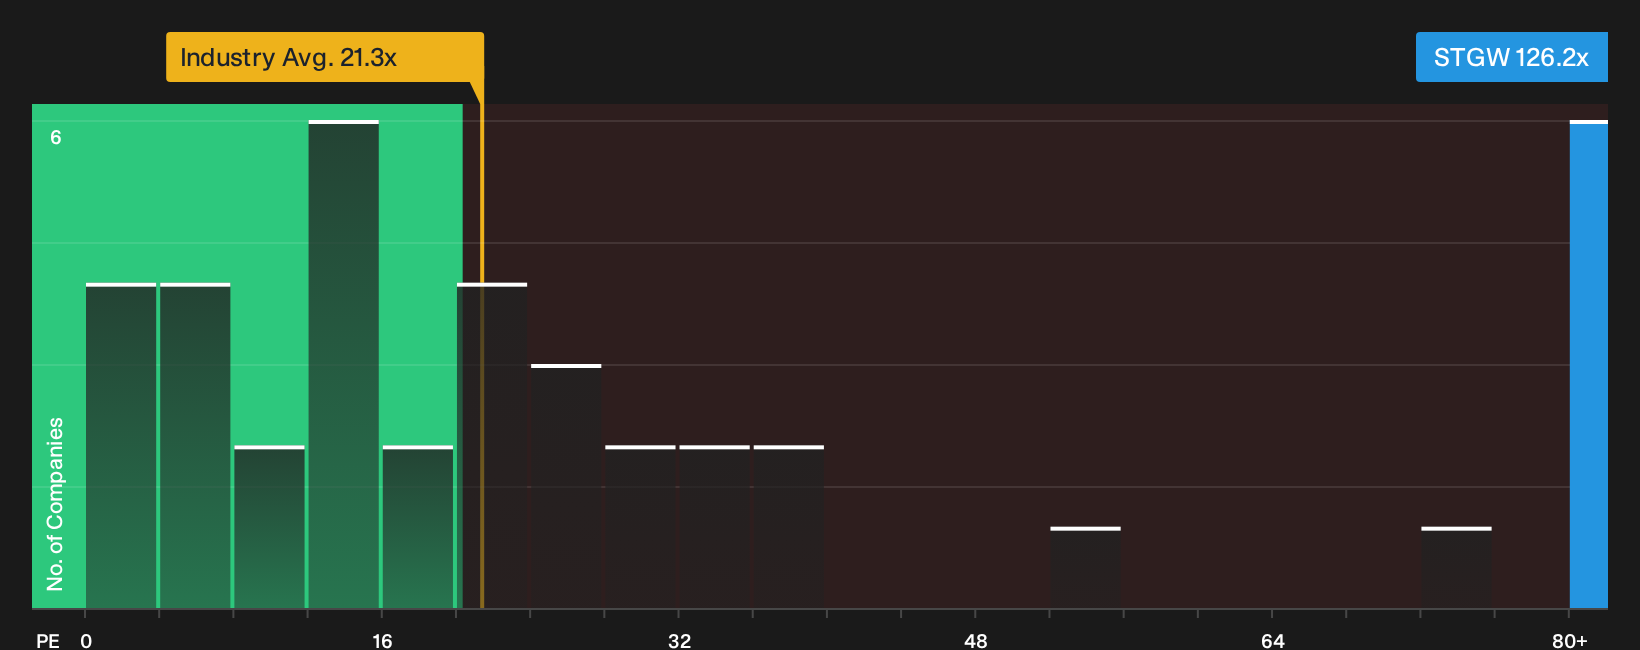
On simple P/E math, Stagwell looks expensive. The stock trades on about 126x earnings, compared with 35.4x for immediate peers and 21.9x for the broader US Media group, while the fair ratio is modeled at 31.4x. That gap points to real downside risk if sentiment cools.
Investors weighing this against the 14% implied upside from fair value need to decide which signal matters more: the rich multiple or the narrative around future earnings quality and cash generation.
For a closer look at how the numbers stack up using earnings based metrics, including how far today’s P/E might drift toward the fair ratio over time, See what the numbers say about this price — find out in our valuation breakdown.
Next Steps
Mixed messages on Stagwell’s valuation and fundamentals can pull you in different directions, so move quickly and test the story against the underlying data yourself. Then weigh up the 3 key rewards and 2 important warning signs
Looking for more investment ideas beyond Stagwell?
If Stagwell has sharpened your focus on valuation and quality, do not stop here. Use these focused stock lists to pressure test and broaden your watchlist.
- Target potential mispricings by running through the 31 high quality undervalued stocks that highlight companies combining quality metrics with discounted valuations.
- Prioritise resilience first by screening the 31 resilient stocks with low risk scores that score well on financial strength and business stability.
- Strengthen capital preservation by filtering for businesses in the list of solid balance sheet and fundamentals (26 results) that pair manageable debt with sound fundamentals.
This article by Simply Wall St is general in nature. We provide commentary based on historical data and analyst forecasts only using an unbiased methodology and our articles are not intended to be financial advice. It does not constitute a recommendation to buy or sell any stock, and does not take account of your objectives, or your financial situation. We aim to bring you long-term focused analysis driven by fundamental data. Note that our analysis may not factor in the latest price-sensitive company announcements or qualitative material. Simply Wall St has no position in any stocks mentioned.
Have feedback on this article? Concerned about the content? Get in touch with us directly. Alternatively, email editorial-team@simplywallst.com