


Is Universal Display (OLED) A Bargain After Its Recent Bounce?
Why Universal Display is back on investor radar
Universal Display (OLED) drew fresh attention after recent trading activity showed a positive price move. This has prompted investors to reassess how the OLED specialist is currently valued in the semiconductor sector.
The latest 1 day share price return of 3.85% to US$80.37 comes after a tougher stretch, with the year to date share price return down 34.04% and the 1 year total shareholder return falling 42.92%. This signals that recent momentum in Universal Display is tentative rather than firmly established.
Compare Universal Display's sharp pullback with other hand picked semiconductor plays showing cleaner momentum and fundamentals by scanning the 90 AI infrastructure stocks today.
Universal Display just logged a sharp single day bounce after a long stretch of weaker returns, which raises a simple question. Is this move about the OLED business, or a short term flip in sentiment before valuation comes under the microscope next?
Most Popular Narrative: 49% Undervalued
The widely followed fair value narrative for Universal Display points to a price of $158.00, which sits well above the latest close at $80.37. That gap has put more weight on how future OLED material volumes, margins and new product lines could justify the difference.
The main thing that has to go right is that the large Gen 8.6 and Gen 6 OLED capacity build-out and customer product roadmaps actually convert into higher OLED material volumes for Universal Display, despite slower recent revenue and material sales and rising competitive and localization pressures.
See why 1 investors see Universal Display as 49% undervalued.
Result: Fair Value of $158.00 (UNDERVALUED)
Still, the bullish Universal Display story can crack if weaker smartphone OLED demand lingers or if commercialization of phosphorescent blue continues to slip relative to customer product timelines.
Find out about the key risks to this Universal Display narrative.
Another View on Universal Display's valuation
The fair value story around Universal Display looks very different when the SWS DCF model is brought into the conversation. On this view, the stock at $80.37 is trading well above an estimated future cash flow value of $38.30, which flags potential overvaluation rather than a discount.
This gap between bullish narrative pricing and cash flow based value forces a simple question. Is the OLED thesis about long run optionality that a model struggles to capture, or is the market paying up for growth and margins that may prove harder to deliver in practice?
Look into how the SWS DCF model arrives at its fair value.
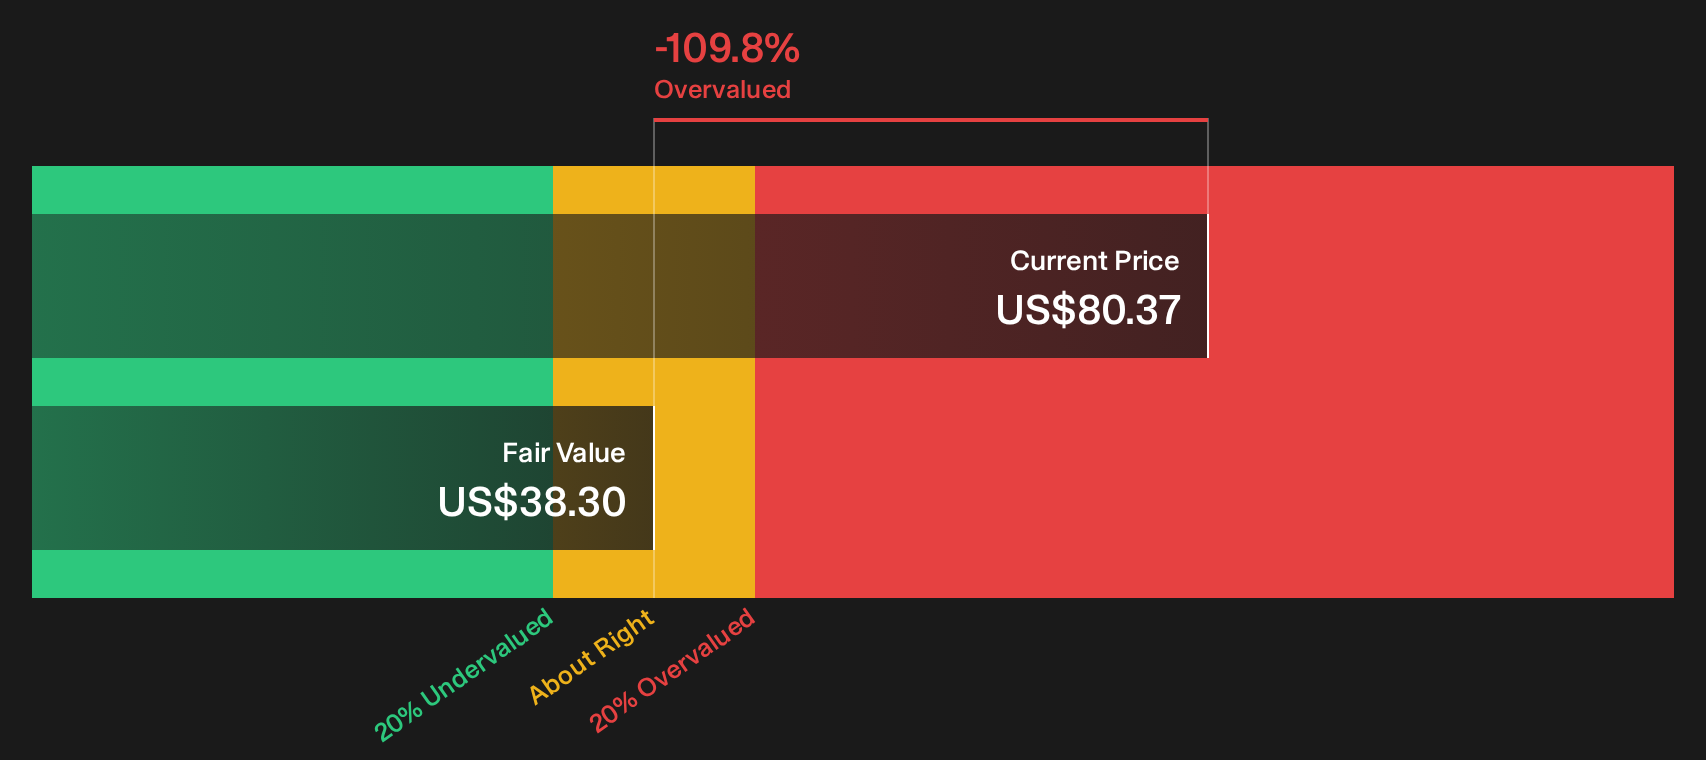
Simply Wall St performs a discounted cash flow (DCF) on every stock in the world every day (check out Universal Display for example). We show the entire calculation in full. You can track the result in your watchlist or portfolio and be alerted when this changes, or use our stock screener to discover 31 high quality undervalued stocks. If you save a screener we even alert you when new companies match - so you never miss a potential opportunity.
Next Steps
Plenty in this Universal Display story pulls in opposite directions, so move quickly, review the underlying data, and weigh both the 4 key rewards and 1 important warning sign.
Looking for more Universal Display investment ideas?
If Universal Display has you rethinking your watchlist, do not stop here. Use the Simply Wall St Screener to uncover fresh opportunities before everyone else moves first.
- Target reliable cash generators by scanning a list of solid balance sheet and fundamentals (26 results) that can better handle shocks and funding needs than more fragile peers.
- Hunt for potential bargains with a 31 high quality undervalued stocks that filters for quality first so you are not just chasing cheap tickers.
- Lock in income ideas through a 7 dividend fortresses that focuses on companies offering higher yields with an eye on resilience.
This article by Simply Wall St is general in nature. We provide commentary based on historical data and analyst forecasts only using an unbiased methodology and our articles are not intended to be financial advice. It does not constitute a recommendation to buy or sell any stock, and does not take account of your objectives, or your financial situation. We aim to bring you long-term focused analysis driven by fundamental data. Note that our analysis may not factor in the latest price-sensitive company announcements or qualitative material. Simply Wall St has no position in any stocks mentioned.
Have feedback on this article? Concerned about the content? Get in touch with us directly. Alternatively, email editorial-team@simplywallst.com