


IREN (IREN) Dropped, What Is Behind The Latest Attention?
IREN (NasdaqGS:IREN) is under scrutiny after management outlined plans to deploy between $25b and $30b in fiscal 2027, while the share price recently dropped 18% despite strong demand for its AI computing capacity.
Recent trading shows that momentum in IREN is mixed. The 1 day share price return is 2.73% and the 30 day share price return is 5.45%, yet the year to date share price return is down 2.20% and the 1 year total shareholder return has declined 17.24%. This comes after a very large 3 year total shareholder return that exceeds 10x your original investment, which suggests that the latest pullback may reflect investors reassessing risk around the ambitious 2027 spending plan rather than walking away from the long term AI and data center story.
Scan 90 AI infrastructure stocks to see how other AI infrastructure players with heavy capital plans compare to IREN in terms of volatility, balance sheet strength, and recent share price momentum.
IREN now trades at a steep discount to analyst targets after that 18% slide. Is the market wisely pricing financing and execution risk, or misreading the scale of the opportunity?
Most Popular Narrative: 42% Undervalued
On Simply Wall St, the most followed narrative values IREN at a fair value of $71.48 versus the last close of $41.76. This frames the current pullback as a large gap between narrative expectations and market pricing.
IREN’s FY26 annual earnings report (for the Australian financial year ended June 30, 2026) triggered an immediate 8%+ post-market drop. Algorithms reacted to a $684M Q4 GAAP net loss driven by $450.4M in non-cash ASIC impairments, while Wall Street focused on a $25B to $30B FY27 CapEx forecast.
See why 269 investors see IREN as 42% undervalued.
Result: Fair Value of $71.48 (UNDERVALUED)
Still, the IREN narrative could quickly crack if the planned US$25b to US$30b FY27 CapEx overwhelms funding options, or if large AI contracts disappoint expectations.
Find out about the key risks to this IREN narrative.
Another Look at IREN’s Valuation
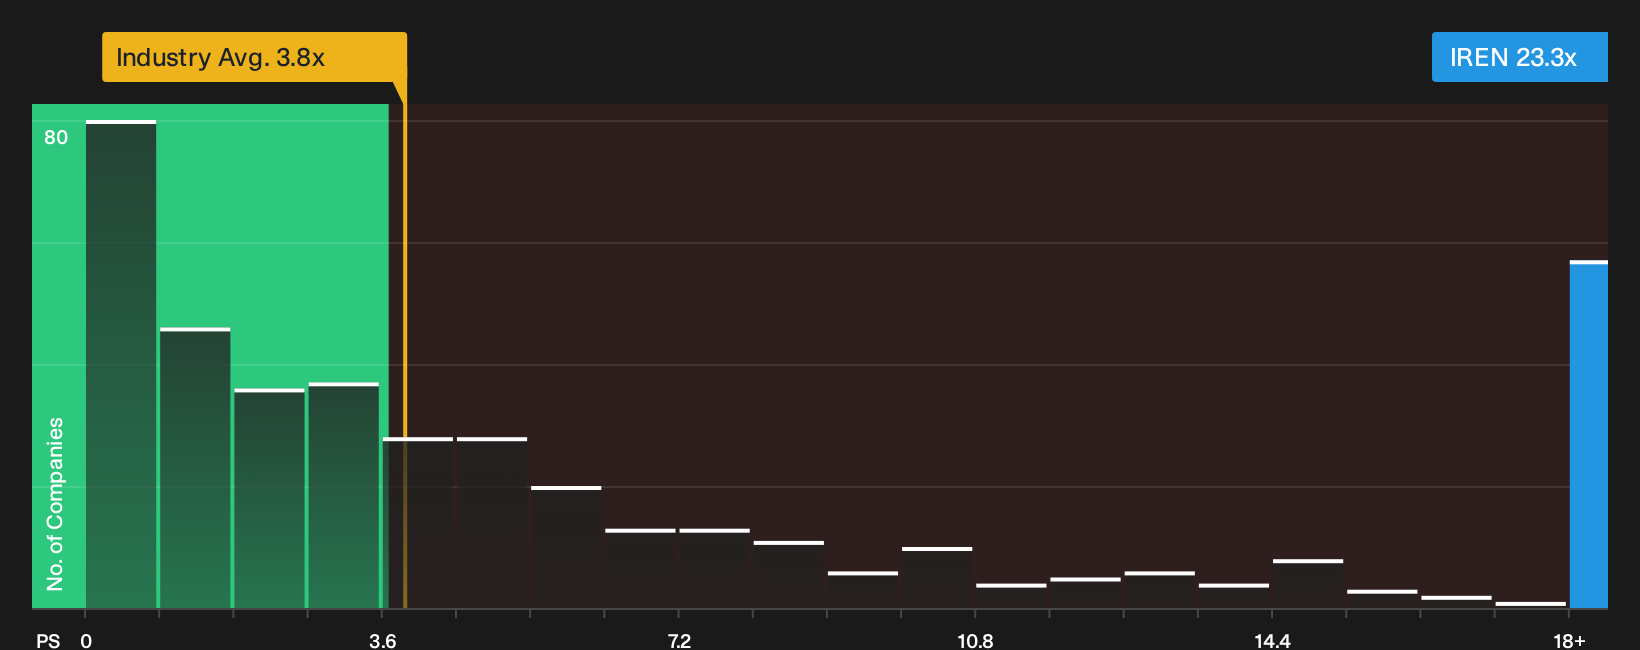
The narrative on IREN leans heavily on future cash flows and long-term contracts, yet the current P/S multiple of 23.3x tells a different story. That figure is far above the US Software industry at 3.8x, peers at 15.5x, and even the 17.3x fair ratio the market could move toward. For investors, that gap signals valuation risk if sentiment or growth assumptions cool, rather than suggesting a straightforward bargain. Is the share price already paying upfront for a lot of that AI buildout?
See what the numbers say about this price — find out in our valuation breakdown.
Next Steps
Mixed signals around IREN’s valuation and risk profile can feel messy, so move quickly, review the underlying data carefully, and judge the balance for yourself using the 1 key reward and 4 important warning signs.
Want more ideas beyond IREN?
If IREN has you thinking harder about risk, reward, and timing, then casting a wider net with fresh watchlist candidates can sharpen every decision you make next.
- Target reliable income streams by scanning companies that show up as 7 dividend fortresses and compare their payouts to the risk profile you are willing to accept.
- Hunt for potential bargains by reviewing businesses flagged as 31 high quality undervalued stocks before prices move and the gap between expectations and reality closes.
- Prioritise resilience by focusing on companies in the 31 resilient stocks with low risk scores so capital is working in businesses with steadier fundamentals and fewer red flags.
This article by Simply Wall St is general in nature. We provide commentary based on historical data and analyst forecasts only using an unbiased methodology and our articles are not intended to be financial advice. It does not constitute a recommendation to buy or sell any stock, and does not take account of your objectives, or your financial situation. We aim to bring you long-term focused analysis driven by fundamental data. Note that our analysis may not factor in the latest price-sensitive company announcements or qualitative material. Simply Wall St has no position in any stocks mentioned.
Have feedback on this article? Concerned about the content? Get in touch with us directly. Alternatively, email editorial-team@simplywallst.com