


Is Reply (BIT:REY) Fully Valued After Its FTSE All World Index Exit?
Reply (BIT:REY) has been dropped from the FTSE All-World Index (USD), a move that can prompt index trackers to adjust holdings and potentially shift short term trading interest around the stock.
Recent trading has been jumpy for Reply, with the share price gaining 6.57% in the last session and 4.85% over the past week. The 90-day share price return of 25.88% contrasts with a far more muted 1-year total shareholder return of 0.83%, suggesting short term momentum has picked up even as longer term gains have been limited.
See how Reply compares with other high momentum software and IT players by checking our curated list of 616 high quality undiscovered gems.
The index exit and sharp rebound have put Reply in a strange spot, where the chart shows fresh momentum while the longer term record looks far more subdued. Are investors now paying up for upside that mostly already happened, or not yet?
Price-to-Earnings of 17.5x: Is it justified?
Reply now trades on a P/E of 17.5x, and that sticker price sits between an internal fair value signal and what the peer group is paying.
The P/E ratio compares what you pay today for each euro of earnings. For a software and IT services group like Reply, where earnings growth often matters more than near term revenue swings, this yardstick gives a quick read on how the market is treating its profitability profile.
On one side, Reply screens as good value against its estimated fair P/E of 32.3x. This implies investors are not paying the level that some models suggest the business could support over time. On the other, the same 17.5x multiple looks expensive next to the 12.8x peer average, which indicates the market is assigning a premium against closer Italian comparables while only roughly in line with the broader European IT industry at 17.7x.
Compared with the sector, that means Reply trades at a clear premium to local peers yet only fractionally below what a fair ratio model points to. Any shift in sentiment could push the market multiple closer to that higher level or cut the premium back towards domestic norms.
Explore the SWS fair ratio for Reply.
Result: Price-to-Earnings of 17.5x (ABOUT RIGHT)
Still, Reply’s recent index removal and the more modest 1 year return of 0.83% leave room for sentiment swings if quarterly numbers or sector demand disappoint.
Find out about the key risks to this Reply narrative.
Another View on Reply’s Valuation
There is a different read when switching from the P/E lens to the SWS DCF model. On that framework, Reply at €123.3 trades above an estimated future cash flow value of €108.93, which points to the shares being overvalued on cash flows even as earnings multiples look more forgiving. Which signal should carry more weight when money is on the line?
Look into how the SWS DCF model arrives at its fair value.
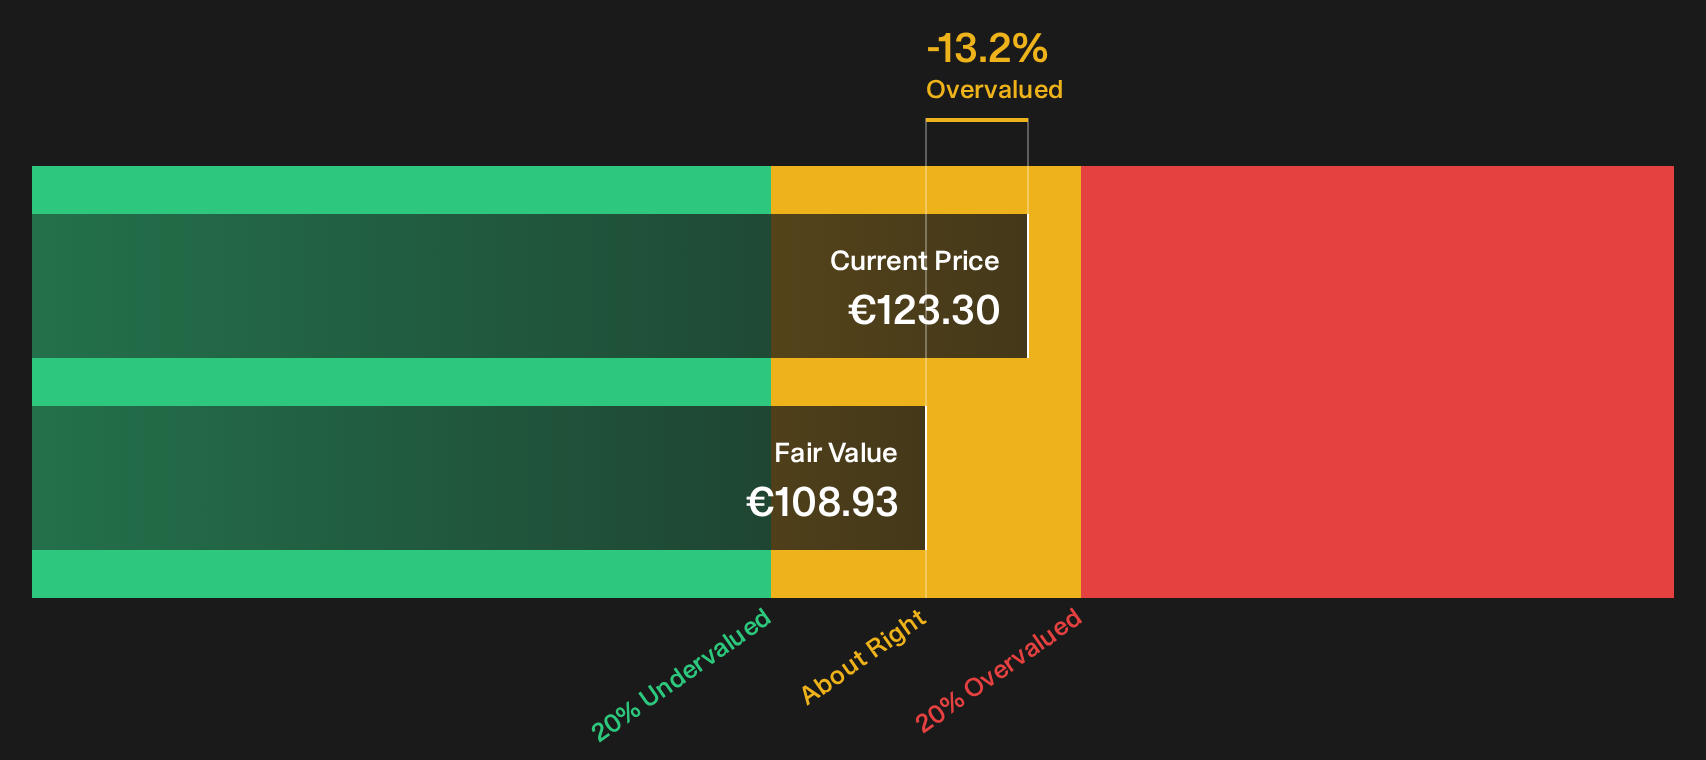
Simply Wall St performs a discounted cash flow (DCF) on every stock in the world every day (check out Reply for example). We show the entire calculation in full. You can track the result in your watchlist or portfolio and be alerted when this changes, or use our stock screener to discover 191 high quality undervalued stocks. If you save a screener we even alert you when new companies match - so you never miss a potential opportunity.
Next Steps
Reading this, you can sense how mixed the mood around Reply really is, with valuation signals pulling in different directions and sentiment moving fast. Act while the data is fresh and test the numbers yourself against the company's upside case by checking the 3 key rewards.
Looking for more investment ideas beyond Reply?
If Reply’s mixed valuation signals caught your attention, do not stop here. Broader ideas across sectors can sharpen your watchlist and highlight fresh opportunities.
- Spot potential mispricings early and compare them with your current holdings by checking a curated pool of 191 high quality undervalued stocks.
- Prioritise resilience and sleep-better-at-night holdings by scanning companies with consistently strong finances through the list of solid balance sheet and fundamentals (207 results).
- Target income-focused opportunities that complement Reply by reviewing a focused set of 168 dividend fortresses.
This article by Simply Wall St is general in nature. We provide commentary based on historical data and analyst forecasts only using an unbiased methodology and our articles are not intended to be financial advice. It does not constitute a recommendation to buy or sell any stock, and does not take account of your objectives, or your financial situation. We aim to bring you long-term focused analysis driven by fundamental data. Note that our analysis may not factor in the latest price-sensitive company announcements or qualitative material. Simply Wall St has no position in any stocks mentioned.
Have feedback on this article? Concerned about the content? Get in touch with us directly. Alternatively, email editorial-team@simplywallst.com