


S&P Global (SPGI) Looks Fully Priced After Its Dividend Declaration
S&P Global (SPGI) has affirmed a fourth-quarter 2026 cash dividend of $0.97 per share, for an annualized payout of $3.88, with payment scheduled for December 10 to shareholders of record on November 25.
The S&P Global share price has retreated in recent months, with the stock down 11.8% on a 30 day share price return basis and 24.3% year to date, while the 3 year total shareholder return of 16.4% suggests that momentum has softened rather than completely reversed.
Track how S&P Global fits into a wider watchlist by scanning a hand picked 28 high quality undervalued stocks that combine compressed sentiment with solid fundamentals.
S&P Global now trades well below the average analyst target, while intrinsic value models cluster much closer to the screen price. Where does fair value actually sit within that range after this pullback?
Most Popular Narrative: 2.1% Overvalued
S&P Global last closed at $388.16, which sits slightly above the most followed narrative fair value estimate of $380, pointing to only a modest valuation gap rather than a deep dislocation.
S&P Global has strong long-term fundamentals, but in the near term, it faces AI-related uncertainty, slower growth expectations, and shifting investor sentiment. At its core, the softer guidance in the ratings segment is being interpreted as a signal about the broader economic environment. When companies pull back on issuing new debt or refinancing existing obligations it often reflects caution. Either firms are facing tighter cash flows or weaker growth prospects, which makes them hesitant to lever up, or they are simply choosing to operate more conservatively in an uncertain macro backdrop. Even the alternative explanation does not fully resolve the issue, because in a confident, expansionary environment, firms would typically still take advantage of cheap debt to enhance returns. This suggests that demand for capital is muted, reinforcing the idea of a slowing or less dynamic economic cycle.
See why 26 investors see S&P Global as 2% overvalued.
Result: Fair Value of $380 (OVERVALUED)
Still, two clear swing factors could flip this script for S&P Global: a stronger rebound in debt issuance and clearer monetization of AI within its data platforms.
Find out about the key risks to this S&P Global narrative.
Another View: S&P Global Through Cash Flows
While the crowd narrative pegs S&P Global at about 2.1% overvalued, the SWS DCF model comes out slightly differently. On that scorecard, the stock at $388.16 sits a touch below an estimated future cash flow value of $392.62, which points to a mild undervaluation instead of excess optimism.
Those two readings pull in opposite directions, so the real question for investors is simple: Do you trust the market mood embedded in earnings multiples, or the slower moving cash flow math underpinning our DCF work?
Look into how the SWS DCF model arrives at its fair value.
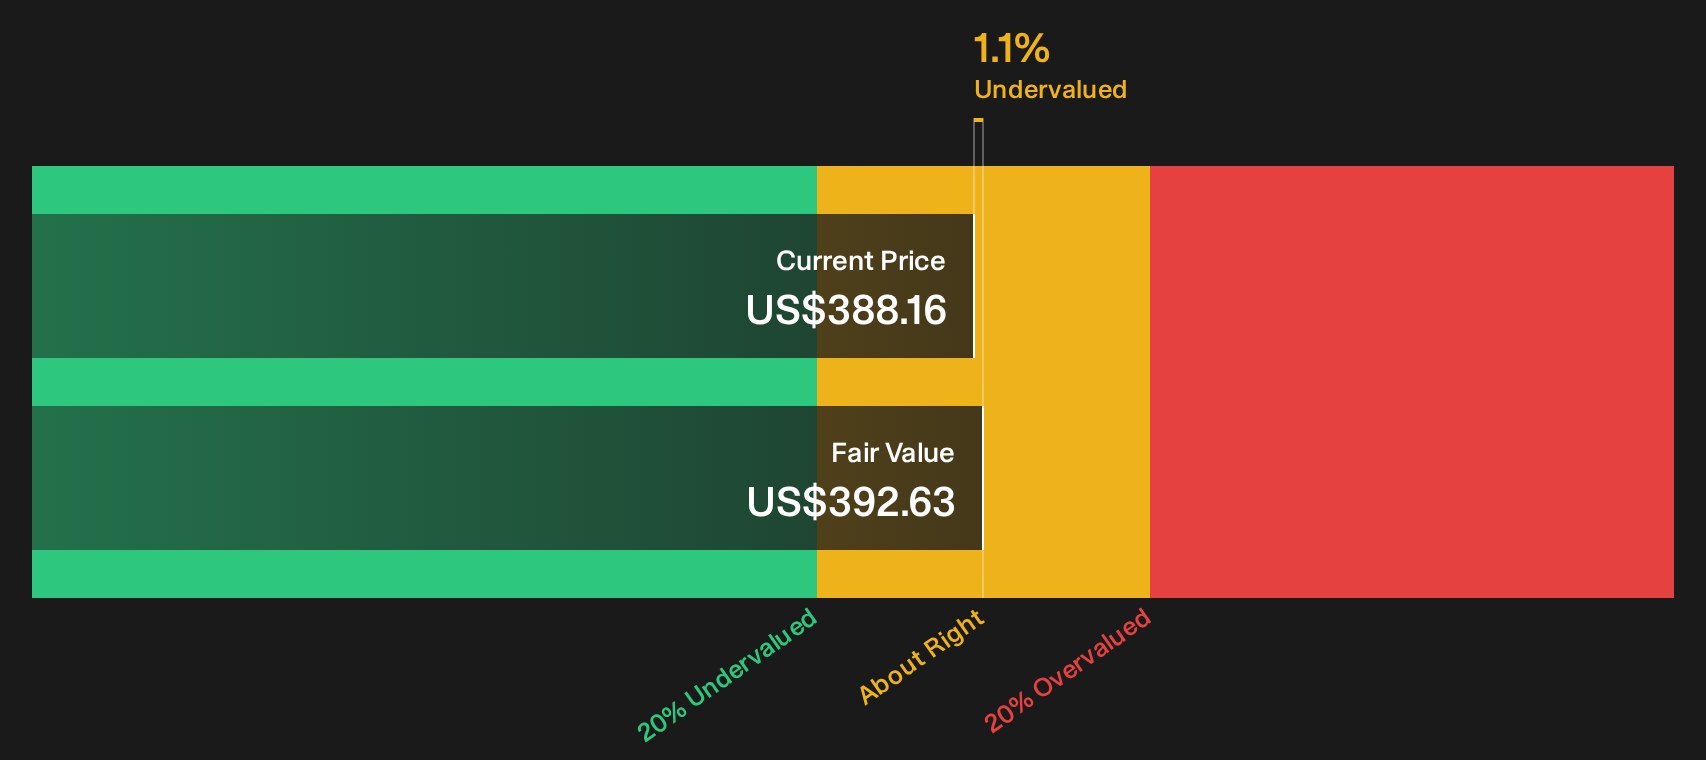
Simply Wall St performs a discounted cash flow (DCF) on every stock in the world every day (check out S&P Global for example). We show the entire calculation in full. You can track the result in your watchlist or portfolio and be alerted when this changes, or use our stock screener to discover 28 high quality undervalued stocks. If you save a screener we even alert you when new companies match - so you never miss a potential opportunity.
Next Steps
If sentiment in this S&P Global story feels split, that is the point. Move quickly, review the numbers yourself, and test your own thesis against the 4 key rewards
Looking for more investment ideas beyond S&P Global?
Do not stop with S&P Global. Use the Simply Wall St Screener to spot other opportunities that match your risk profile, time horizon, and income goals.
- Target potential mispricings by scanning a hand picked 28 high quality undervalued stocks that pair compressed sentiment with balance sheets that still look resilient on the numbers.
- Build income resilience by reviewing a focused 7 dividend fortresses that prioritise higher yields combined with ongoing payout capacity checks.
- Dial down downside risk by filtering through a curated 31 resilient stocks with low risk scores that screens for businesses with sturdier finances and more stable fundamentals.
This article by Simply Wall St is general in nature. We provide commentary based on historical data and analyst forecasts only using an unbiased methodology and our articles are not intended to be financial advice. It does not constitute a recommendation to buy or sell any stock, and does not take account of your objectives, or your financial situation. We aim to bring you long-term focused analysis driven by fundamental data. Note that our analysis may not factor in the latest price-sensitive company announcements or qualitative material. Simply Wall St has no position in any stocks mentioned.
Have feedback on this article? Concerned about the content? Get in touch with us directly. Alternatively, email editorial-team@simplywallst.com