


How Revenue Guidance Will Impact Manchester United Stock
- Manchester United plc recently reported fourth quarter 2026 results, with sales of £157.5 million, a net loss of £28.72 million and basic loss per share from continuing operations of £0.1666. The club also issued fiscal 2027 revenue guidance of £740 million to £760 million.
- The combination of a wider quarterly loss and a clearly defined 2027 revenue range gives investors a sharper view of how Manchester United is balancing current financial strain against planned commercial and football operations over the next year.
- Next, the focus shifts to how Manchester United's new 2027 revenue guidance might reshape the existing investment narrative for the club.
Compare Manchester United's new revenue guidance with other clubs and related businesses under earnings pressure by scanning our curated list of 31 resilient stocks with low risk scores.
Manchester United Investment Narrative Recap
To own Manchester United, you need to believe the club can turn a global brand and Old Trafford into steadier cash generation despite ongoing losses. The widened quarterly loss and the new £740 million to £760 million revenue range keep the focus on execution. The near term hinge is whether operations can fund squad rebuild plans without stretching the balance sheet too far.
The biggest immediate risk is cost control. High wages, transfer spending and reliance on uneven player trading can make earnings choppy, especially when profits are already elusive. The latest figures underline that profitability is still some distance away, so any slip in on pitch performance or commercial deals could bite harder.
The new fiscal 2027 revenue guidance from Manchester United is the most relevant update. Management now pegs revenue at £740 million to £760 million. That range gives you a clearer yardstick for the next year. It frames how much room there might be to support wage commitments, transfer activity and stadium operations while the squad rebuild continues.
With the club currently unprofitable and not forecast to reach profitability over the next three years, that guidance becomes a key reference point for short term catalysts. It helps you judge whether planned improvements in midfield, tighter transfer discipline and greater use of player trading are translating into a more resilient top line or if the risk of ongoing losses remains elevated.
Manchester United's current analyst story assumes revenue will grow by 7.8% a year, with revenues reaching £858.3 million and earnings of £95.3 million by 2029. That outlook implies an earnings swing of about £113 million from the present £18.1 million loss to the projected profit level.
Uncover why Manchester United's fair value indicates a 15% potential upside to its current price, which could narrow quickly.
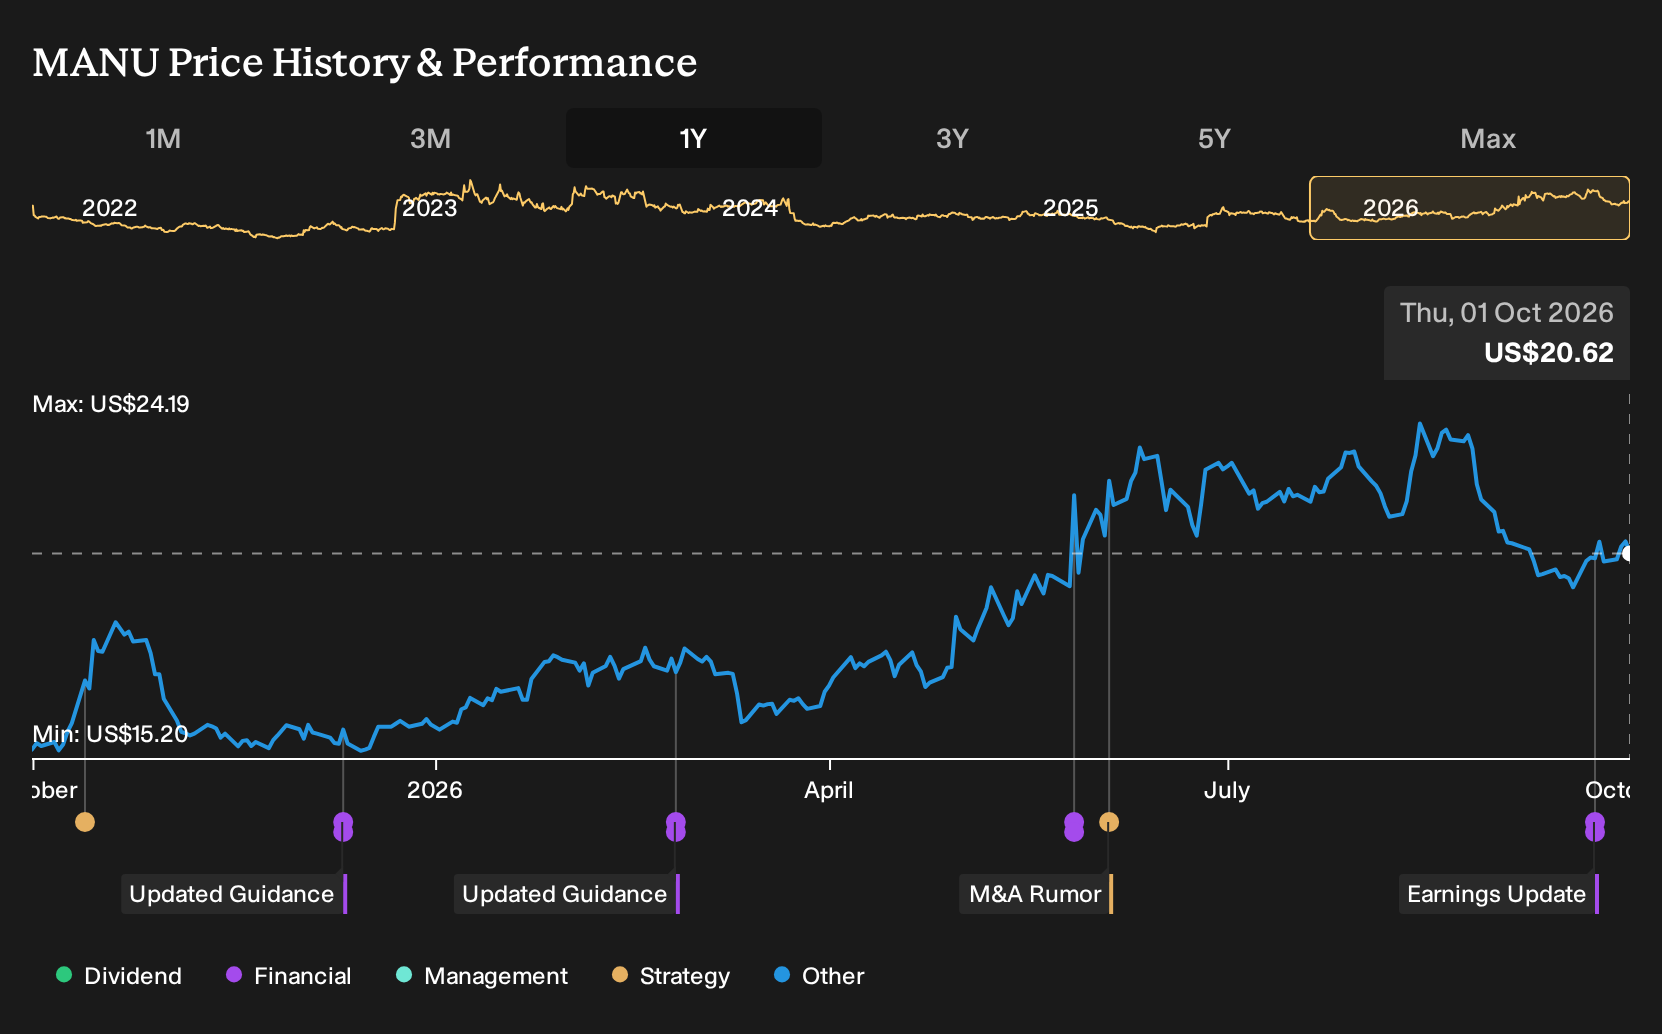
Exploring Other Perspectives
Three fair value estimates from the Simply Wall St Community cluster between £19.22 and £23.65 per share, which shows how widely Manchester United is being priced by different retail investors. Before reacting to that band, weigh it against risks around wage commitments and injury issues, and explore these alternative views for yourself.
Explore 2 other Manchester United fair value estimates, including one that suggests up to 7% downside from the current price.
The Verdict Is Yours
Don't just follow the ticker. Dig into the data and build a conviction that's truly your own.
- A great starting point for your Manchester United research is our analysis highlighting 1 important warning sign that could impact your investment decision.
- See our latest analysis for Manchester United. The report includes a comprehensive fundamental analysis summarized in a single visual, the Snowflake, making it easy to evaluate Manchester United's overall financial health at a glance.
Looking For More Manchester United Style Investment Ideas?
Once you have formed a view on Manchester United, it can help to widen the lens and compare it with other opportunities that fit different risk and income profiles. The Simply Wall St Screener offers several ways to do that quickly using prebuilt sets of filters.
- If you want steadier balance sheets to contrast with Manchester United's current losses, start with a list of solid balance sheet and fundamentals (25 results), which already filters for stronger financial footing.
- If potential mispricing is what interests you most, line up clubs and other sectors against Manchester United by scanning a curated pool of 28 high quality undervalued stocks that pass fundamental checks.
- If reliable income is part of your plan, compare Manchester United with stocks geared toward payouts using a focused set of 7 dividend fortresses that screen for higher yields.
This article by Simply Wall St is general in nature. We provide commentary based on historical data and analyst forecasts only using an unbiased methodology and our articles are not intended to be financial advice. It does not constitute a recommendation to buy or sell any stock, and does not take account of your objectives, or your financial situation. We aim to bring you long-term focused analysis driven by fundamental data. Note that our analysis may not factor in the latest price-sensitive company announcements or qualitative material. Simply Wall St has no position in any stocks mentioned.
Have feedback on this article? Concerned about the content? Get in touch with us directly. Alternatively, email editorial-team@simplywallst.com