


Chiyoda (TSE:6366) Stock Looks Cheap Relative To Its Earnings
Chiyoda has delivered very strong gains over the past few years, so the obvious question now is whether the current share price lines up with what its earnings can support. With the stock recently closing at ¥677, investors are increasingly focused on what the underlying profit stream really justifies.
- Chiyoda shares have returned about 89.6% over the past 3 years, which puts real weight on whether that move is fully supported by the earning power of the business.
- The company’s profile as an engineering and project contractor means profitability can depend heavily on how reliably it converts complex contracts into steady earnings, which matters a lot when you judge the stock on its income base.
- The analysts covering Chiyoda have run their own numbers. See what analysts think Chiyoda's shares could be worth.
The stock’s next move may depend on whether Chiyoda’s current earnings justify today’s valuation or suggest that expectations have run ahead of the underlying business.
If you want a wider reference point for judging whether Chiyoda’s earnings support its current valuation, it can help to compare it with other 17 high quality undervalued stocks.
Does Chiyoda Look Undervalued on Earnings?
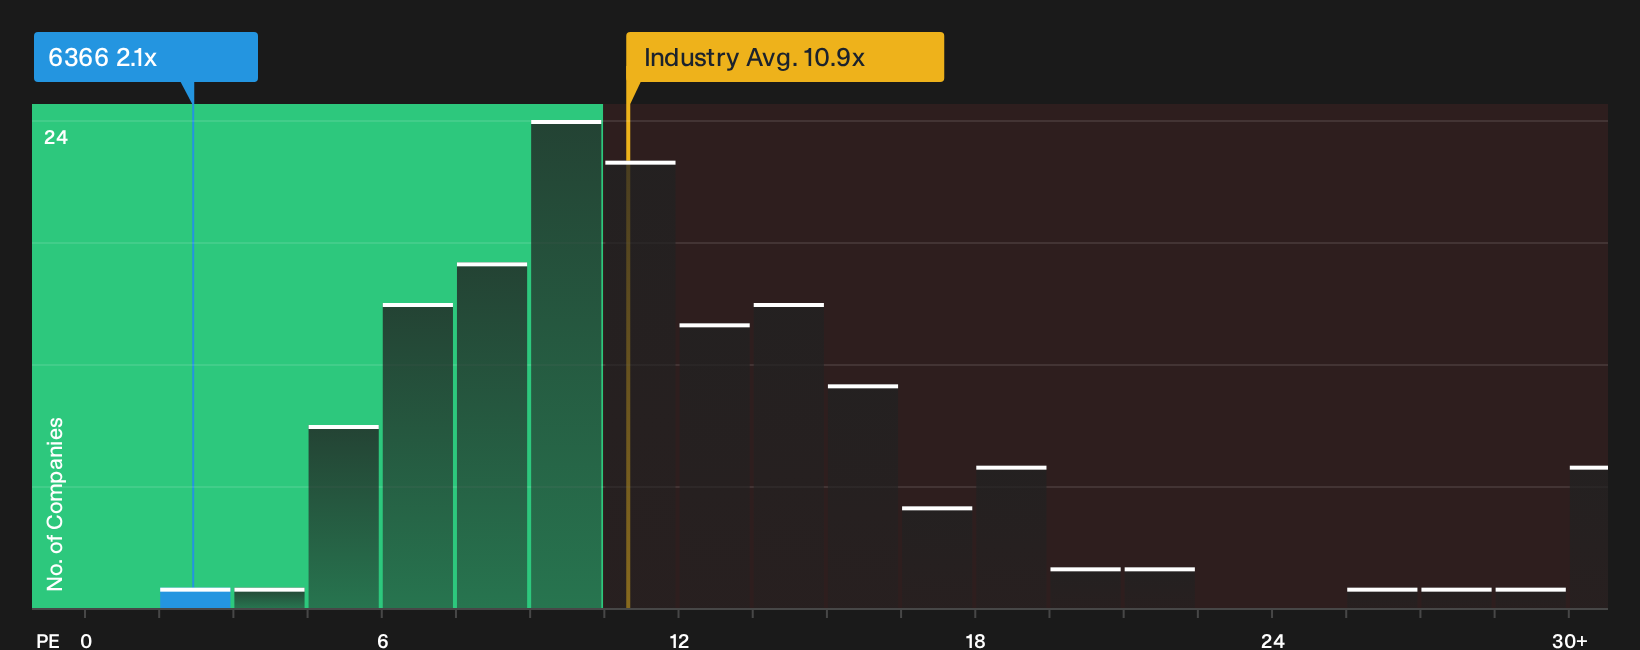
The P/E ratio works well for Chiyoda because investors are already focused on the earnings power behind its contract backlog. On this measure, the shares trade on a P/E of about 2.1x, which is far below the Construction industry average of roughly 10.9x and also well under the wider peer group at about 13.7x. For a business where profits can swing with project timing, that is a very low earnings tag.
A tailored fair multiple that considers Chiyoda’s own margins, growth profile, scale and risk points to a higher P/E than where the shares change hands today. That places the current 2.1x ratio below what this framework would expect for the company’s earnings profile, so investors are being asked to pay a relatively modest price for each yen of profit. Explore the numbers behind Chiyoda's P/E valuation.
The Chiyoda Narrative: What Would Justify Today's Price?
Chiyoda’s Simply Wall St Narratives pick up where the P/E puzzle leaves off and map out what sort of future for growth, margins and earnings would need to play out for today’s share price to look either restrained or stretched. Each scenario ties a valuation number to a clear view of how Chiyoda’s profitability and risk profile might evolve. This gives you something concrete to revisit as fresh information comes through.
A clear, number-driven narrative on Chiyoda gives you a structured way to test what kind of future for its growth, margins and execution would line up with the current P/E. It turns vague sentiment into explicit assumptions that can be checked against actual results as new data arrives.
Share your own Narrative for Chiyoda and set out the assumptions behind your valuation.
Before focusing on Chiyoda’s valuation, check what the risk checks are saying
Chiyoda’s earnings-based price tag only tells part of the story, because separate checks have flagged issues that could matter a lot for anyone weighing the shares. Take a closer look at 2 warning signs (1 major) before settling on a valuation.
This article by Simply Wall St is general in nature. We provide commentary based on historical data and analyst forecasts only using an unbiased methodology and our articles are not intended to be financial advice. It does not constitute a recommendation to buy or sell any stock, and does not take account of your objectives, or your financial situation. We aim to bring you long-term focused analysis driven by fundamental data. Note that our analysis may not factor in the latest price-sensitive company announcements or qualitative material. Simply Wall St has no position in any stocks mentioned.
Have feedback on this article? Concerned about the content? Get in touch with us directly. Alternatively, email editorial-team@simplywallst.com