


Undiscovered Gems In Asia And 2 Other Small Caps With Strong Potential
In the current market landscape, Asia's small-cap stocks have been experiencing a mixed performance, with indices like the Russell 2000 pulling back amidst broader economic uncertainties and inflation concerns. Despite these challenges, investors are keenly exploring opportunities within this segment, focusing on companies that demonstrate resilience and growth potential in evolving sectors such as technology and manufacturing. Identifying promising stocks in this environment involves looking for those with strong fundamentals and innovative strategies that can thrive amid fluctuating market conditions.
Top 10 Undiscovered Gems With Strong Fundamentals In Asia
| Name | Debt To Equity | Revenue Growth | Earnings Growth | Health Rating |
|---|---|---|---|---|
| Apex Mining | 22.02% | 24.39% | 37.14% | ★★★★★★ |
| Ad-Sol Nissin | NA | 7.22% | 15.60% | ★★★★★★ |
| Chongqing Machinery & Electric | 18.92% | 8.43% | 26.16% | ★★★★★★ |
| Eurocharm Holdings | 2.66% | 3.48% | 7.39% | ★★★★★★ |
| Taiyo KagakuLtd | 0.68% | 6.49% | 11.88% | ★★★★★★ |
| SPRIX | 13.12% | 6.95% | -5.71% | ★★★★★★ |
| Xiamen King Long Motor Group | 93.39% | 11.34% | 66.65% | ★★★★★☆ |
| Forth Smart Service | 44.85% | -3.80% | 10.19% | ★★★★★☆ |
| Sing Investments & Finance | 0.10% | 5.85% | 7.00% | ★★★★☆☆ |
| Shengda ResourcesLtd | 57.58% | 8.61% | 9.90% | ★★★☆☆☆ |
We're going to check out a few of the best picks from our screener tool.
Tongling Nonferrous Metals GroupLtd (SZSE:000630)
Simply Wall St Value Rating: ★★★★☆☆
Overview: Tongling Nonferrous Metals Group Co., Ltd. is a company involved in the mining, smelting, and processing of non-ferrous metals with a market capitalization of approximately CN¥77.51 billion.
Operations: Tongling Nonferrous Metals Group generates revenue primarily from its non-trade segment, which accounts for CN¥218.02 billion, while the trade segment contributes CN¥339.58 million.
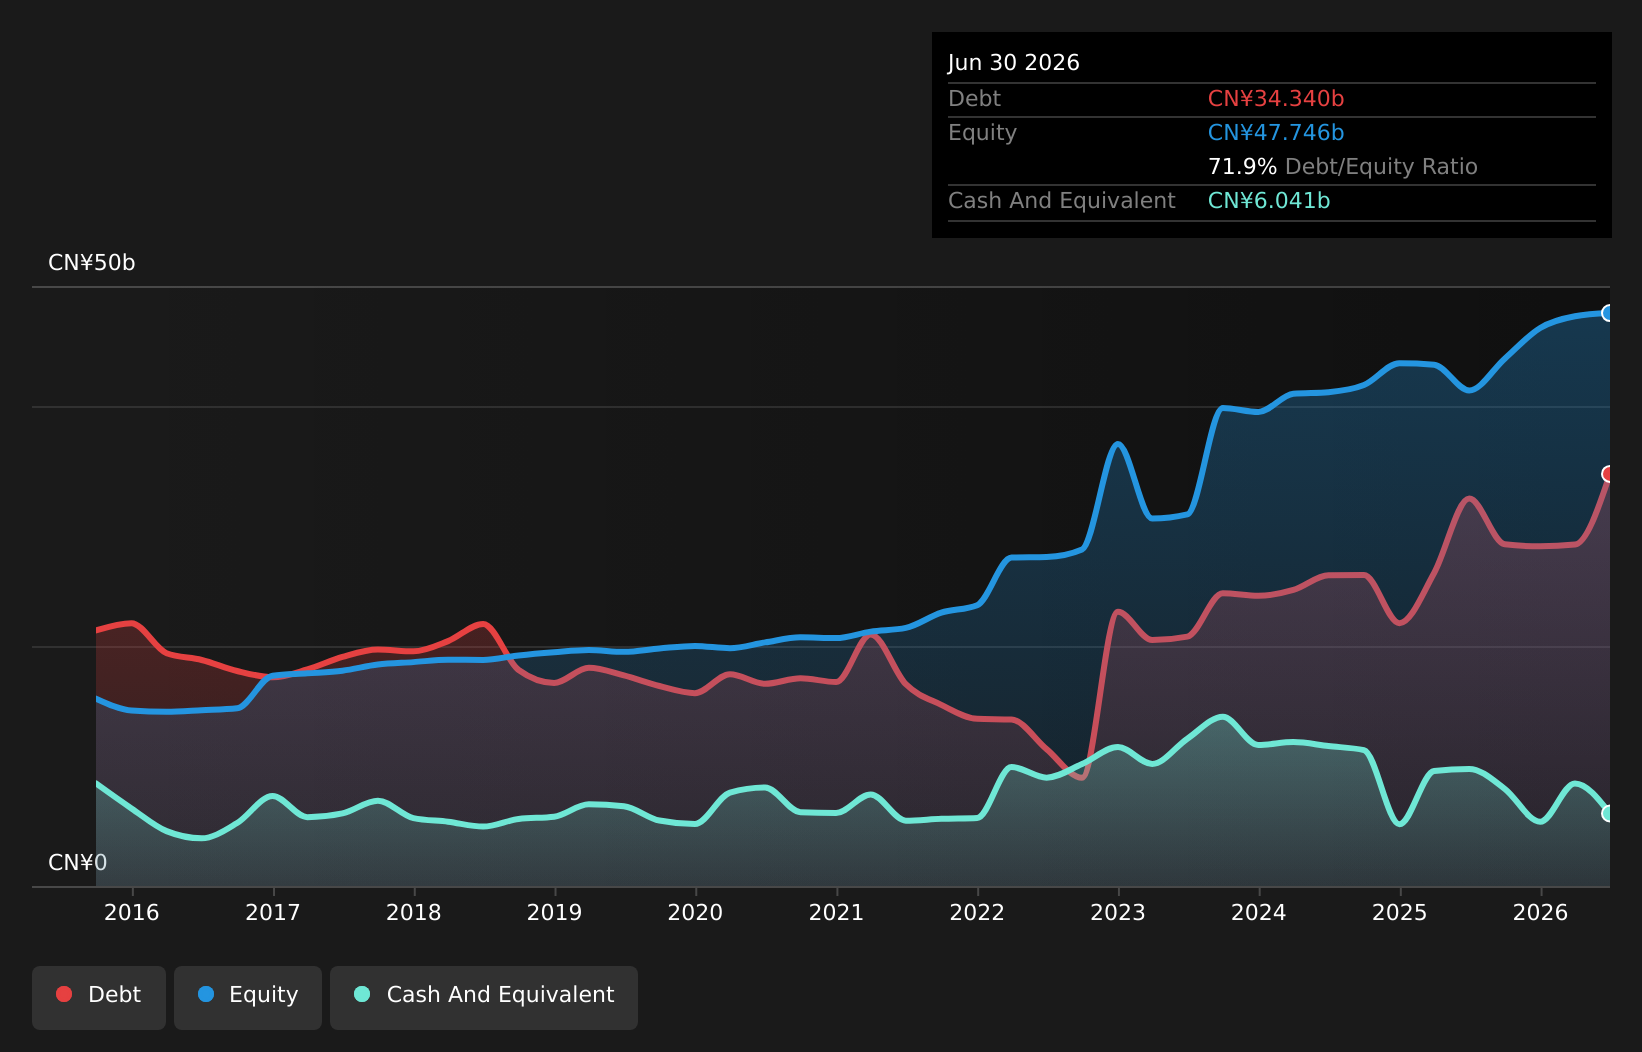
Tongling Nonferrous Metals Group, a notable player in the metals and mining sector, has demonstrated significant growth with earnings surging 92% over the past year, outpacing industry growth of 23.3%. Despite a high net debt to equity ratio of 59.3%, its interest payments are well-covered by EBIT at 20.7 times coverage. Recent financials reveal revenue for the first half of 2026 reached CNY 121 billion, up from CNY 76 billion last year, while net income rose to CNY 2.99 billion from CNY 1.44 billion. The company also approved an interim cash dividend plan at its recent meeting.
Alltop Technology (TPEX:3526)
Simply Wall St Value Rating: ★★★★★☆
Overview: Alltop Technology Co., Ltd. operates in Taiwan and China, focusing on the research, design, development, manufacture, and sale of electronic connectors with a market capitalization of NT$17.91 billion.
Operations: Alltop Technology generates revenue primarily from its electronic coupling segment, amounting to NT$4.39 billion. The company's market capitalization stands at NT$17.91 billion.
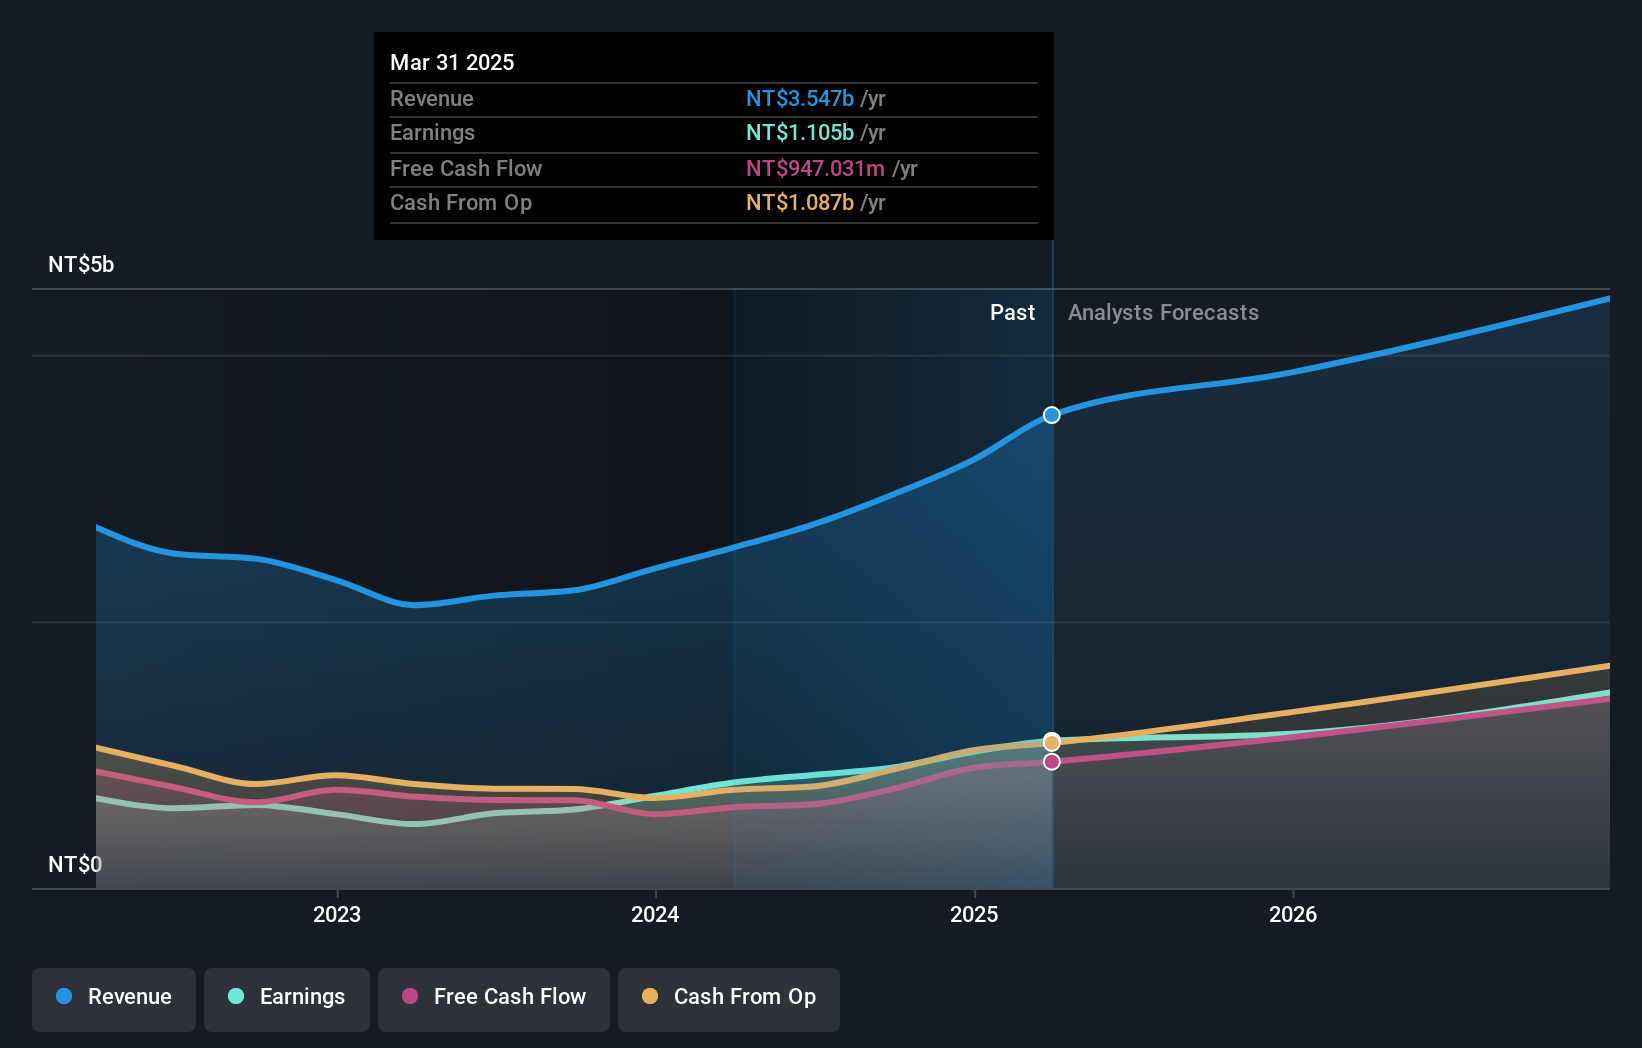
Alltop Technology, a promising player in the electronics sector, has demonstrated solid performance with recent quarterly sales of TWD 1.21 billion, up from TWD 924.81 million last year. Net income also saw an increase to TWD 289.94 million from TWD 269.86 million a year ago, indicating robust growth despite not outpacing the industry average of 31%. The company trades at approximately 61.6% below its estimated fair value and boasts high-quality earnings with a debt-to-equity ratio rising from 15.3% to 51.2% over five years, suggesting careful financial management amidst expansion efforts and future growth potential at around an expected rate of 31%.
- Click here and access our complete health analysis report to understand the dynamics of Alltop Technology.
Evaluate Alltop Technology's historical performance by accessing our past performance report.
Transcend Information (TWSE:2451)
Simply Wall St Value Rating: ★★★★★★
Overview: Transcend Information, Inc. is involved in the manufacturing, processing, and trading of computer software and hardware along with peripheral equipment and parts across Taiwan, other parts of Asia, the United States, Europe, and globally; it has a market cap of NT$124.66 billion.
Operations: Transcend's primary revenue stream is from computer peripherals, generating NT$43.36 billion. The company's financial performance can be evaluated through its net profit margin trends over time.
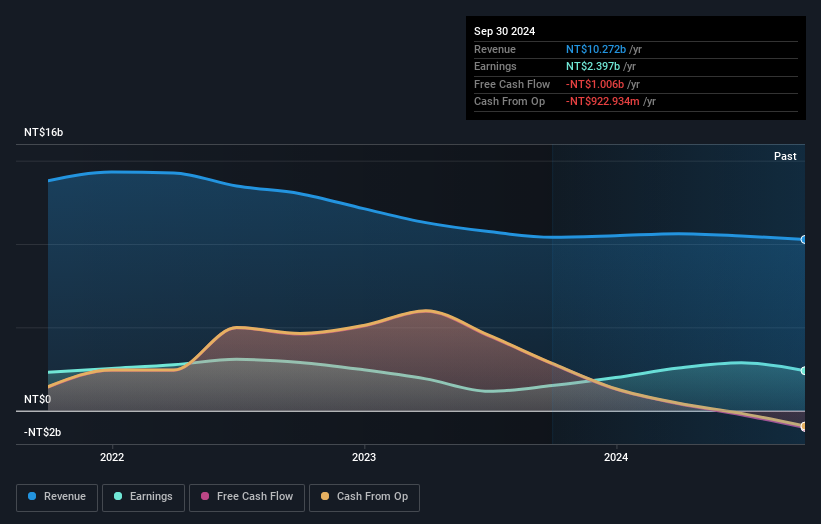
Transcend Information, a tech player with no debt, reported impressive earnings results for Q2 2026, showing sales of TWD 18.82 billion compared to TWD 3.23 billion the previous year. Net income soared to TWD 11.9 billion from TWD 420.76 million, reflecting significant growth in profitability and efficiency. Basic earnings per share jumped to TWD 27.7 from just TWD 0.98 a year ago, highlighting robust performance in continuing operations. The company enjoys strong non-cash earnings and trades at nearly 91% below its estimated fair value, suggesting potential undervaluation against industry peers despite its rapid growth trajectory exceeding the tech sector's average by a wide margin of over fourteen-fold last year alone.
- Navigate through the intricacies of Transcend Information with our comprehensive health report here.
Explore historical data to track Transcend Information's performance over time in our Past section.
Taking Advantage
- Unlock more gems! Our Asian Undiscovered Gems With Strong Fundamentals screener has unearthed 114 more companies for you to explore.Click here to unveil our expertly curated list of 117 Asian Undiscovered Gems With Strong Fundamentals.
- Got skin in the game with these stocks? Elevate how you manage them by using Simply Wall St's portfolio, where intuitive tools await to help optimize your investment outcomes.
- Invest smarter with the free Simply Wall St app providing detailed insights into every stock market around the globe.
Looking For Alternative Opportunities?
- Explore high-performing small cap companies that haven't yet garnered significant analyst attention.
- Fuel your portfolio with companies showing strong growth potential, backed by optimistic outlooks both from analysts and management.
- Find companies with promising cash flow potential yet trading below their fair value.
This article by Simply Wall St is general in nature. We provide commentary based on historical data and analyst forecasts only using an unbiased methodology and our articles are not intended to be financial advice. It does not constitute a recommendation to buy or sell any stock, and does not take account of your objectives, or your financial situation. We aim to bring you long-term focused analysis driven by fundamental data. Note that our analysis may not factor in the latest price-sensitive company announcements or qualitative material. Simply Wall St has no position in any stocks mentioned.
Have feedback on this article? Concerned about the content? Get in touch with us directly. Alternatively, email editorial-team@simplywallst.com