


Fuji (TSE:6134) Could Be 39% Undervalued Following FTSE All World Index Inclusion
Fuji (TSE:6134) has just been added to the FTSE All-World Index in USD terms, a move that can attract index-tracking capital and fresh institutional attention to the stock.
Fuji's inclusion in the FTSE All-World Index follows strong recent momentum, with a 1-day share price return of 1.98% and a 7-day share price return of 6.27%, pointing to rising interest around the stock.
Over a longer window, the picture is more mixed, since the 30-day share price return of 6.94% contrasts with a 90-day period where the share price declined 9.72%. This suggests enthusiasm has cooled at times even as the story has evolved.
For longer term holders, the headline numbers are the total shareholder return figures. A 1-year total shareholder return of 193.24% and a 3-year total shareholder return of 263.84% highlight how powerful the move has been for investors who stayed in the trade.
Across both short and long horizons, Fuji has delivered very strong total shareholder returns, while more recent share price moves hint that momentum is still present but no longer running in a straight line.
Scan other robotics and automation plays showing similar index-driven interest by reviewing the hand-picked 93 robotics and automation stocks alongside Fuji's latest inclusion story.
The share price has already moved hard and Fuji now sits inside a major global index. The real question is whether the current valuation still offers an attractive trade off between upside and risk.
Price-to-Earnings of 29.6x: Is it justified?
Fuji now trades on a P/E of 29.6x, which puts the current ¥7,629 share price on a richer earnings multiple than many Machinery peers.
The P/E ratio compares what investors are paying today for each unit of earnings. For a robotics and machine tools producer like Fuji, this measure often reflects how much confidence the market has in future profit growth and the resilience of those earnings.
That 29.6x figure is high against both the JP Machinery industry average of 13.3x and the peer average of 20.3x, so the stock carries a clear premium. At the same time, the estimated fair P/E of 31x suggests the current multiple is not wildly out of line with where the market could reasonably settle if the company delivers on expectations.
Explore the SWS fair ratio for Fuji.
Result: Price-to-Earnings of 29.6x (ABOUT RIGHT)
Still, Fuji faces clear risks if demand for electronic component mounting robots softens or if robotics peers start trading on compressed P/E multiples.
Find out about the key risks to this Fuji narrative.
Another View on Fuji's Valuation
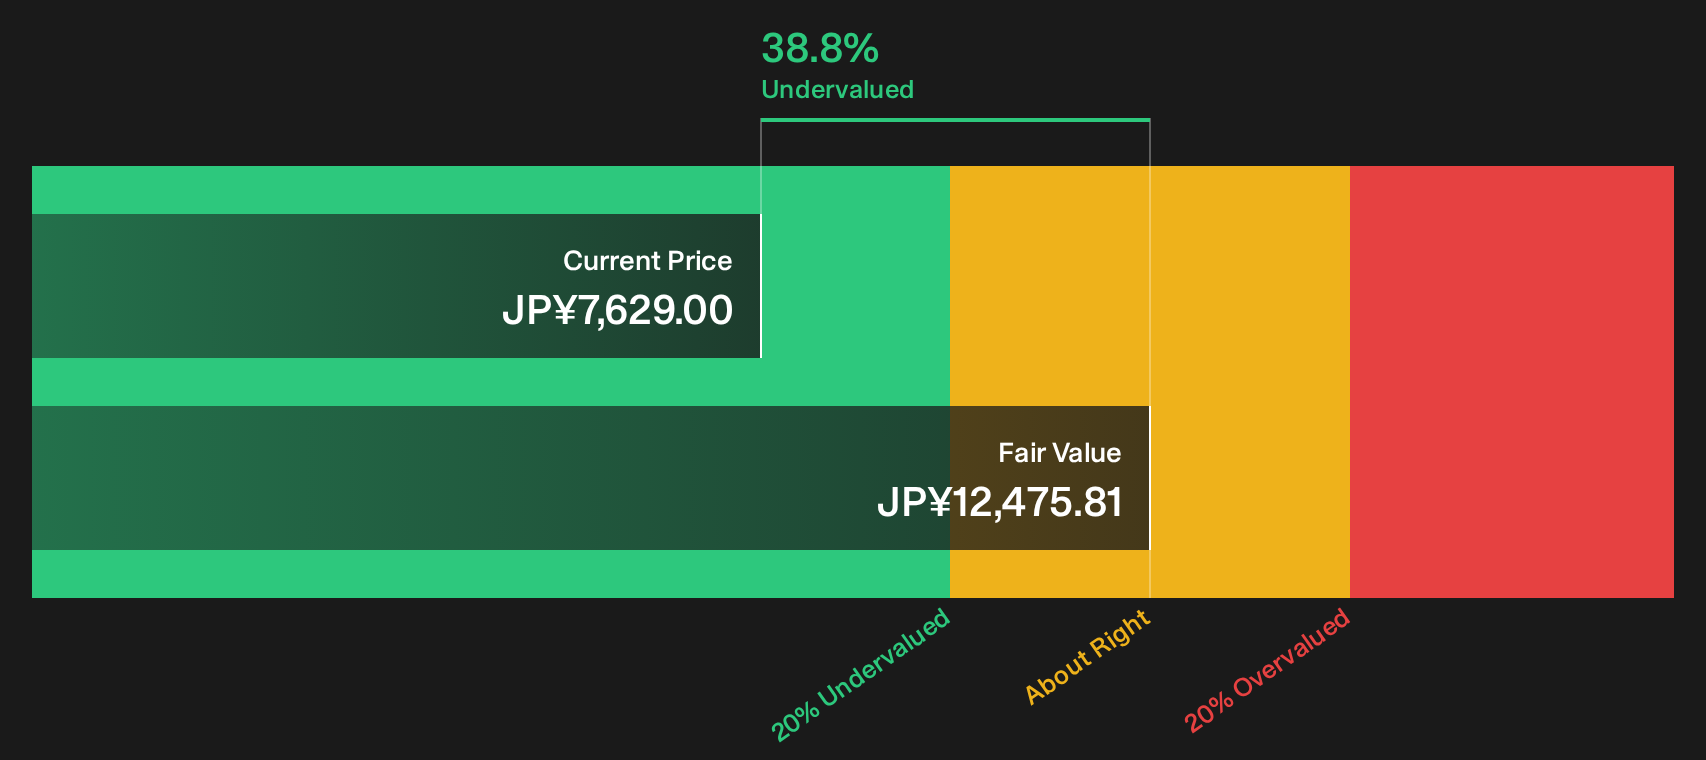
The earnings multiple paints one picture, but the SWS DCF model tells a different story. On that cash flow view, Fuji at ¥7,629 is trading around 38.8% below an estimated fair value of ¥12,475.81, which points to a very different balance between price and expectations.
That kind of gap suggests the market price could be baking in much more caution than the cash flow model implies. It raises a simple question for investors: Is the DCF being too generous, or is the share price still catching up to the fundamentals?
Look into how the SWS DCF model arrives at its fair value.
Simply Wall St performs a discounted cash flow (DCF) on every stock in the world every day (check out Fuji for example). We show the entire calculation in full. You can track the result in your watchlist or portfolio and be alerted when this changes, or use our stock screener to discover 18 high quality undervalued stocks. If you save a screener we even alert you when new companies match - so you never miss a potential opportunity.
Next Steps
Plenty in this Fuji story points in different directions, so move quickly, review the underlying figures yourself, then weigh the 3 key rewards and 2 important warning signs
Looking for more Fuji investment ideas?
Do not stop with Fuji alone. Take a few minutes to scan other opportunities on Simply Wall Street's Screener so you are not leaving potential ideas on the table.
- Target resilience first and review a curated set of companies with sturdier financial footing through the list of solid balance sheet and fundamentals (23 results).
- Hunt for mispriced quality and sift through the 76 high quality undiscovered gems that may not yet be crowded with attention.
- Dial down risk and focus on durability by checking companies that appear steadier on key metrics via the 21 resilient stocks with low risk scores.
This article by Simply Wall St is general in nature. We provide commentary based on historical data and analyst forecasts only using an unbiased methodology and our articles are not intended to be financial advice. It does not constitute a recommendation to buy or sell any stock, and does not take account of your objectives, or your financial situation. We aim to bring you long-term focused analysis driven by fundamental data. Note that our analysis may not factor in the latest price-sensitive company announcements or qualitative material. Simply Wall St has no position in any stocks mentioned.
Have feedback on this article? Concerned about the content? Get in touch with us directly. Alternatively, email editorial-team@simplywallst.com