


Discover CapsoVision And 2 Other Leading Growth Stocks With Strong Insider Ownership
The United States market has experienced a 12% drop in the last week, yet it remains up by 12% over the past year, with earnings expected to grow by 18% annually. In this fluctuating environment, stocks with high insider ownership often attract attention as they suggest confidence from those most familiar with the company's potential for growth.
Top 10 Growth Companies With High Insider Ownership In The United States
| Name | Insider Ownership | Earnings Growth |
| Upstart Holdings (UPST) | 14.0% | 68.4% |
| Standard Nuclear (STDN) | 18.8% | 61.3% |
| Precigen (PGEN) | 11.7% | 54% |
| Nu Holdings (NU) | 22.8% | 22.3% |
| Karman Holdings (KRMN) | 14.4% | 56.4% |
| Himax Technologies (HIMX) | 29.2% | 70.2% |
| Figure Technology Solutions (FIGR) | 21.4% | 32.2% |
| Dave (DAVE) | 16.7% | 23.6% |
| Carlyle Group (CG) | 27.4% | 22% |
| Almonty Industries (ALM) | 10.8% | 57.0% |
Here's a peek at a few of the choices from the screener.
CapsoVision (CV)
Simply Wall St Growth Rating: ★★★★★☆
Overview: CapsoVision, Inc. is a medical technology company specializing in the manufacture and marketing of endoscopic video imaging devices for gastrointestinal system imaging, with a market cap of $346.32 million.
Operations: The company's revenue is primarily generated from its Capsule Endoscopy segment, which accounts for $13.89 million.
Insider Ownership: 37.2%
Earnings Growth Forecast: 57.8% p.a.
CapsoVision's growth potential is underscored by its forecasted revenue increase of 51.9% annually, outpacing the US market average. The company has seen substantial insider buying recently, indicating confidence in its trajectory. Recent FDA clearance for AI Highlights enhances their CapsoCam Plus system, potentially streamlining clinical workflows and boosting adoption. However, despite revenue growth of 11% last year, CapsoVision remains unprofitable but is expected to achieve profitability within three years.
- Navigate through the intricacies of CapsoVision with our comprehensive analyst estimates report here.
- Our comprehensive valuation report raises the possibility that CapsoVision is priced higher than what may be justified by its financials.

Agora (API)
Simply Wall St Growth Rating: ★★★★☆☆
Overview: Agora, Inc. operates a real-time engagement platform-as-a-service across the United States, China, and other international markets with a market cap of approximately $347.67 million.
Operations: The company's revenue is primarily derived from its Internet Telephone segment, which generated $151.69 million.
Insider Ownership: 28.6%
Earnings Growth Forecast: 54.4% p.a.
Agora's growth trajectory is highlighted by its forecasted annual earnings increase of over 50%, surpassing the US market average. Recent earnings reports show a rise in revenue to $40.42 million for Q2 2026, with net income at $2.2 million, up from last year. The company completed a significant share buyback, enhancing shareholder value. However, while revenue growth is strong at 14% annually, it lags behind the highest-growth peers in the sector.
- Click to explore a detailed breakdown of our findings in Agora's earnings growth report.
- Insights from our recent valuation report point to the potential overvaluation of Agora shares in the market.
MNTN (MNTN)
Simply Wall St Growth Rating: ★★★★★☆
Overview: MNTN, Inc. operates a technology platform focused on performance marketing for Connected TV and has a market cap of $762.24 million.
Operations: The company generates revenue of $313.33 million from its Internet Software & Services segment.
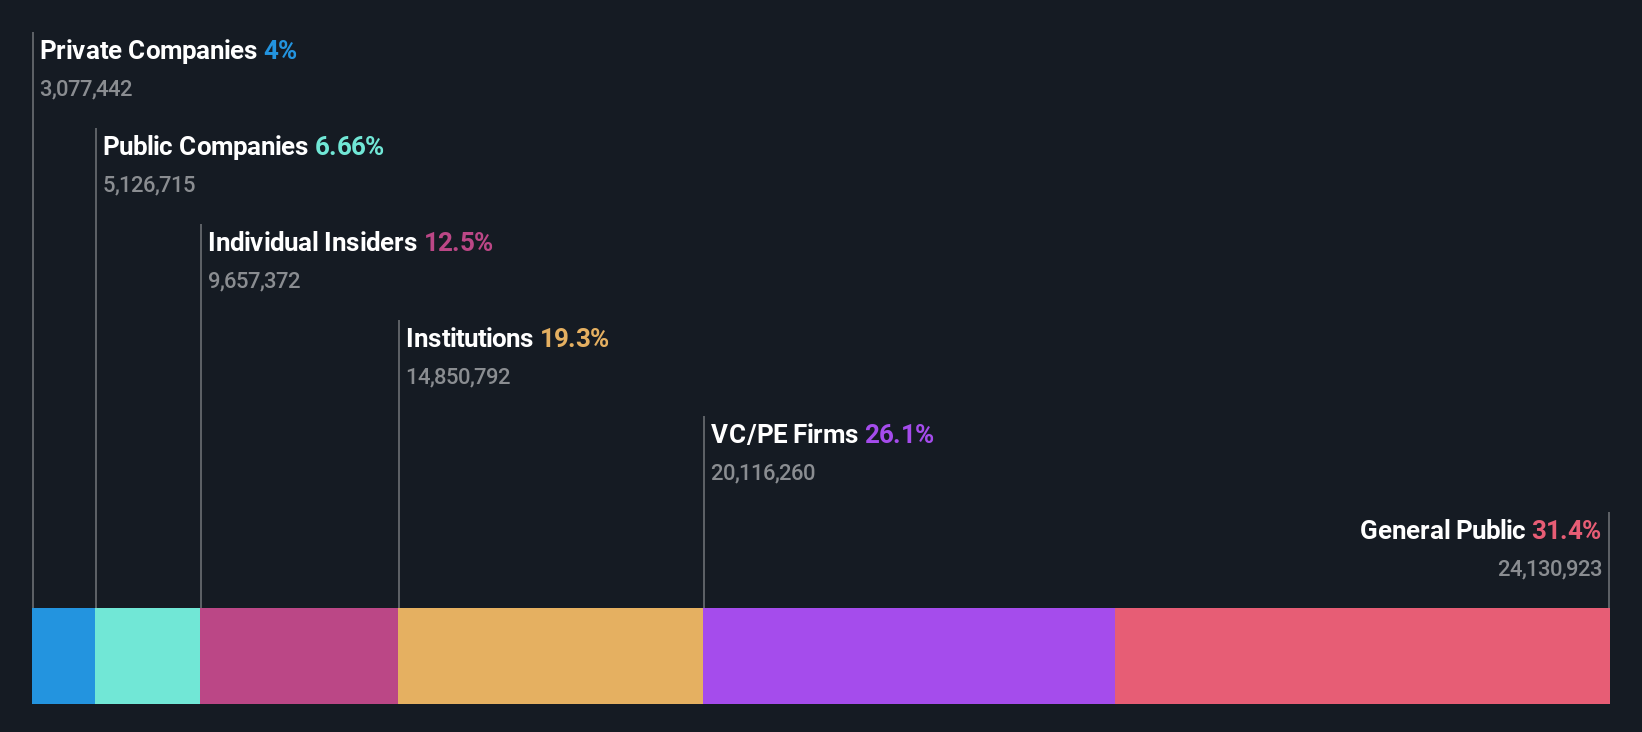
Insider Ownership: 12.1%
Earnings Growth Forecast: 22.5% p.a.
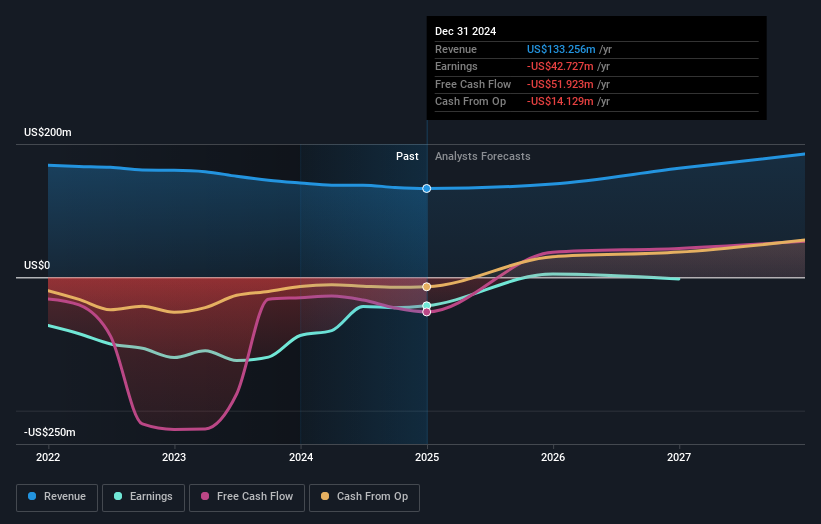
MNTN's growth prospects are bolstered by expected annual earnings growth of 22.5%, surpassing the US market average. Trading at a significant discount to its estimated fair value, it offers good relative value compared to peers. Recent integrations with AppsFlyer and Klaviyo enhance its Performance TV capabilities, potentially driving further revenue growth. Despite facing legal challenges regarding patent infringement, MNTN maintains a robust balance sheet with $237.3 million in cash and no debt obligations.
- Dive into the specifics of MNTN here with our thorough growth forecast report.
- The analysis detailed in our MNTN valuation report hints at an deflated share price compared to its estimated value.
Make It Happen
- Delve into our full catalog of 184 Fast Growing US Companies With High Insider Ownership here.
- Contemplating Other Strategies? Uncover the next big thing with financially sound penny stocks that balance risk and reward.
This article by Simply Wall St is general in nature. We provide commentary based on historical data and analyst forecasts only using an unbiased methodology and our articles are not intended to be financial advice. It does not constitute a recommendation to buy or sell any stock, and does not take account of your objectives, or your financial situation. We aim to bring you long-term focused analysis driven by fundamental data. Note that our analysis may not factor in the latest price-sensitive company announcements or qualitative material. Simply Wall St has no position in any stocks mentioned.The analysis only considers stock directly held by insiders. It does not include indirectly owned stock through other vehicles such as corporate and/or trust entities. All forecast revenue and earnings growth rates quoted are in terms of annualised (per annum) growth rates over 1-3 years.
Have feedback on this article? Concerned about the content? Get in touch with us directly. Alternatively, email editorial-team@simplywallst.com