


Sumitomo Realty & Development (TSE:8830) Goes Ex Dividend As Valuation Signals Split
Sumitomo Realty & Development (TSE:8830) has drawn fresh attention after announcing a total dividend of $0.16 per share, with the ex-dividend date set for 29 September 2026.
That dividend update comes at a time when Sumitomo Realty & Development’s share price has softened. The stock is down 4.42% over the past month and 18.55% year to date. However, longer term momentum remains intact, supported by a 3-year total shareholder return of 86.49% and a 5-year total shareholder return of 68.66%.
Compare Sumitomo Realty & Development’s income story with a curated set of resilient payers by scanning our 20 dividend fortresses alongside this latest dividend move.
Sumitomo Realty & Development now offers a fresh dividend on a share price that has pulled back sharply this year. Does that combination still tip the risk reward balance in favour of new buyers, or has most of the upside already been taken?
Preferred P/E of 13.1x: Is it justified?
Valuation on Sumitomo Realty & Development hinges on a P/E of 13.1x at a last close of ¥3,179, which places the stock at a richer earnings multiple than many peers even though it screens slightly cheaper than the broader Japanese market on this metric.
The P/E ratio compares the current share price with earnings per share and gives a quick sense of how much investors are willing to pay for each unit of profit. For a real estate group with diversified activities across leasing, housing and development, this benchmark often reflects expectations around recurring income, asset quality and how resilient those profits might be through cycles.
Here the picture is mixed. On one hand, Sumitomo Realty & Development trades at 13.1x earnings, below the wider JP market at 13.8x. This suggests investors are not assigning a premium relative to the market as a whole. On the other hand, the same 13.1x is above both the JP Real Estate industry average of 9.5x and the peer group average of 12.6x. This points to a richer tag than many sector comparables. The estimated fair P/E of 16.2x is even higher, implying the multiple could shift closer to that level if the market placed more weight on its earnings profile and recent profit growth.
Explore the SWS fair ratio for Sumitomo Realty & Development.
Result: Price-to-earnings of 13.1x (ABOUT RIGHT)
Still, the narrative around Sumitomo Realty & Development could be tested if its Japan focused revenue base faces weaker leasing demand or if profit growth slows materially.
Find out about the key risks to this Sumitomo Realty & Development narrative.
Another View on Sumitomo Realty & Development’s Value
While the 13.1x P/E for Sumitomo Realty & Development looks roughly aligned with its fair ratio of 16.2x, the SWS DCF model points in a very different direction. On that cash flow view, the shares trade well above an estimated value of ¥996.94, which frames the current price as overvalued.
When one method hints at reasonable earnings pricing and another flags a stretched cash flow picture, it raises the question of which lens may be more relevant for a long term investor in Sumitomo Realty & Development.
Look into how the SWS DCF model arrives at its fair value.
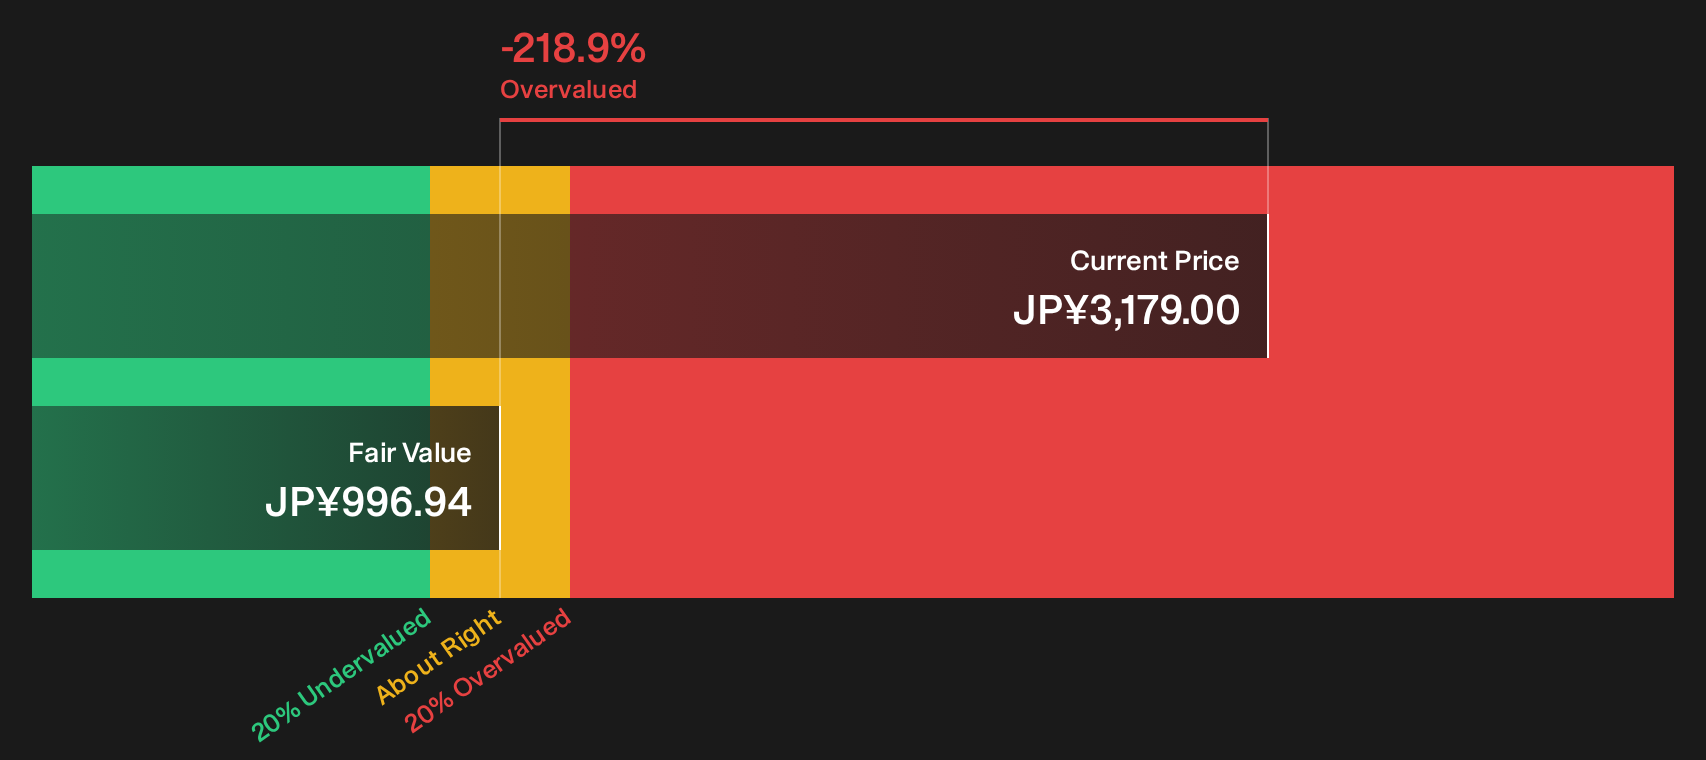
Simply Wall St performs a discounted cash flow (DCF) on every stock in the world every day (check out Sumitomo Realty & Development for example). We show the entire calculation in full. You can track the result in your watchlist or portfolio and be alerted when this changes, or use our stock screener to discover 19 high quality undervalued stocks. If you save a screener we even alert you when new companies match - so you never miss a potential opportunity.
Next Steps
With Sumitomo Realty & Development pulling in mixed signals on value and sentiment, the data can point in different directions depending on what you prioritise. To see the full spread of viewpoints on both the upside and the concerns, start by weighing the 3 key rewards and 1 important warning sign.
Looking for more investment ideas beyond Sumitomo Realty & Development?
If you like the detail on Sumitomo Realty & Development, do not stop here. The right watchlist comes from widening your net with focused screeners.
- Target potential value opportunities before they get crowded by scanning our 19 high quality undervalued stocks. This filters for quality businesses priced below what their fundamentals may justify.
- Prioritise resilience in tougher conditions by using the list of solid balance sheet and fundamentals (22 results) to focus on companies with stronger finances and fewer balance sheet red flags.
- Spot potential early movers that the market may be overlooking by checking the 76 high quality undiscovered gems and seeing which stocks meet your criteria before others catch on.
This article by Simply Wall St is general in nature. We provide commentary based on historical data and analyst forecasts only using an unbiased methodology and our articles are not intended to be financial advice. It does not constitute a recommendation to buy or sell any stock, and does not take account of your objectives, or your financial situation. We aim to bring you long-term focused analysis driven by fundamental data. Note that our analysis may not factor in the latest price-sensitive company announcements or qualitative material. Simply Wall St has no position in any stocks mentioned.
Have feedback on this article? Concerned about the content? Get in touch with us directly. Alternatively, email editorial-team@simplywallst.com