


Natural Gas Moves Toward its Peak Season with LNG Demand Rising
I asked if it was time to begin accumulating natural gas in an August 14, 2026, Barchart article, where I concluded with the following:
I believe that the odds favor higher natural gas prices over the coming peak demand season beginning in the fall. Therefore, this could be the perfect time to begin accumulating a long position in futures, call options, UNG, or BOIL, leaving room to add on declines over the coming weeks and months. When considering BOIL, the leverage requires attention to risk, making accumulation dangerous. Tight stops and reentry into risk positions using BOIL as optimizing leveraged products depend on the ability to accept small losses in the quest for oversized gains.
Nearby NYMEX natural gas futures were trading at $2.775 per MMBtu on August 14, and the price has moved higher. More importantly, U.K. and Dutch prices have risen, increasing demand for U.S. LNG. I am bullish on natural gas prices over the coming weeks and months.
U.S. natural gas futures are trending higher
The daily continuous contract chart of NYMEX U.S. natural gas futures shows a trend of higher lows since the end of the 2025/2026 withdrawal season, when natural gas inventories decline.
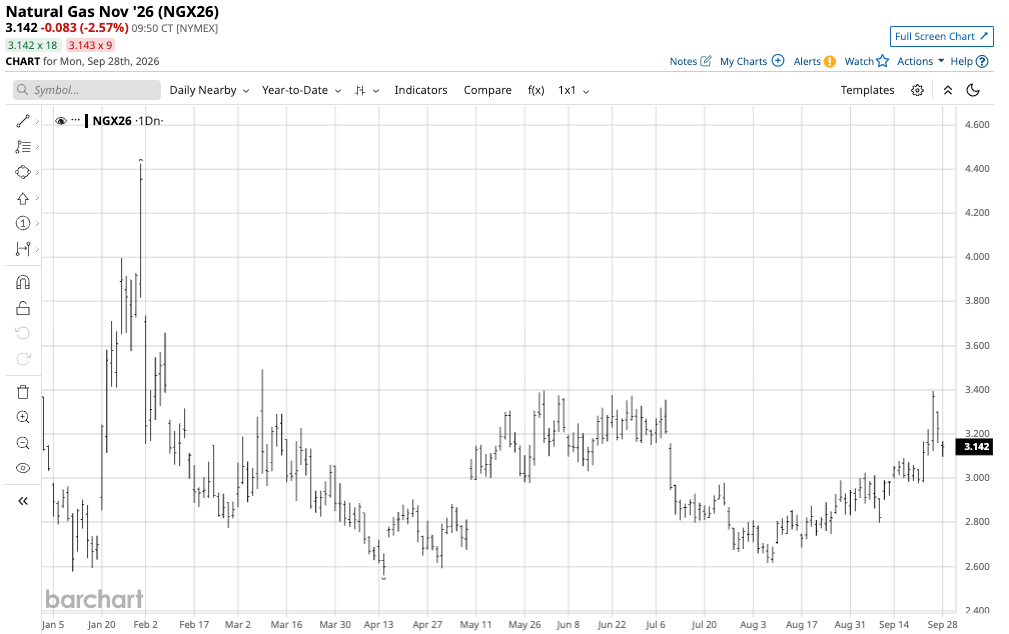
The chart shows the pattern of higher lows since the April 14, 2026, low of $2.561 per MMBtu. Natural gas futures made higher lows of $2.592 on April 30, $2.616 on August 6, $2.617 on August 7, and $2.685 per MMBtu on August 17. After reaching a low of $2.799 on September 9, the bullish trend of higher lows remained intact. The nearby price reached a high of $3.395 per MMBtu on September 24, and was near $3.15 on September 28, as it has made higher highs since the August 6 low.
While U.S. natural gas prices have been inching higher as winter approaches, the most bullish factor is price action across the Atlantic in Europe.
U.K. and Dutch prices are rising
The U.S., Russia, and Qatar are the leading LNG exporting countries. In the past, natural gas could only travel from production to consumption by pipeline. Technological advances in gas liquefication have allowed LNG to travel by ocean vessel.
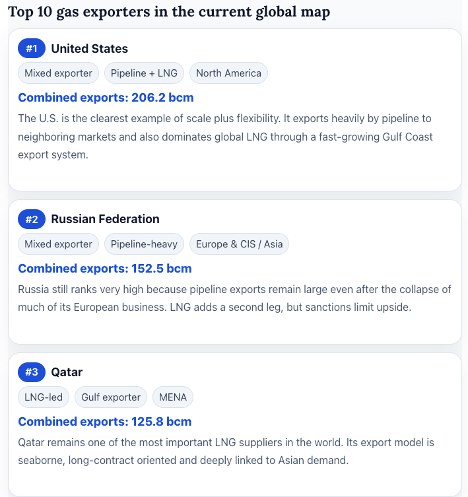
While the U.S. leads the world in natural gas exports, including pipeline and LNG, Russia and Qatar, the second and third largest exporters, combined account for 35% more exports than the U.S.
Sanctions on Russia, the ongoing conflict in the Middle East, Iranian attacks on neighboring countries, and logistical issues around the Strait of Hormuz, the Bab al-Mandeb Strait, and Black Sea ports, could limit exports from Russia and Qatar and cause natural gas and LNG shortages in Western Europe. Futures prices reflect the increasing supply concerns as winter approaches.
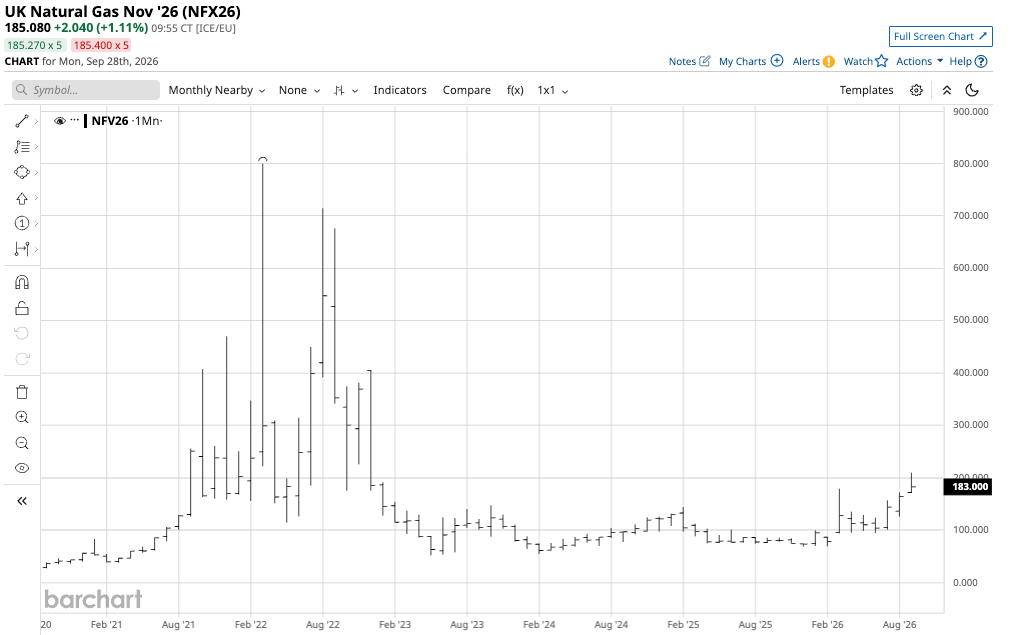
The monthly chart shows that U.K. natural gas futures prices at 185.05 on September 28, 2026, are significantly higher than the September 2025 high of 86.32 GBP per 1,000 therms.
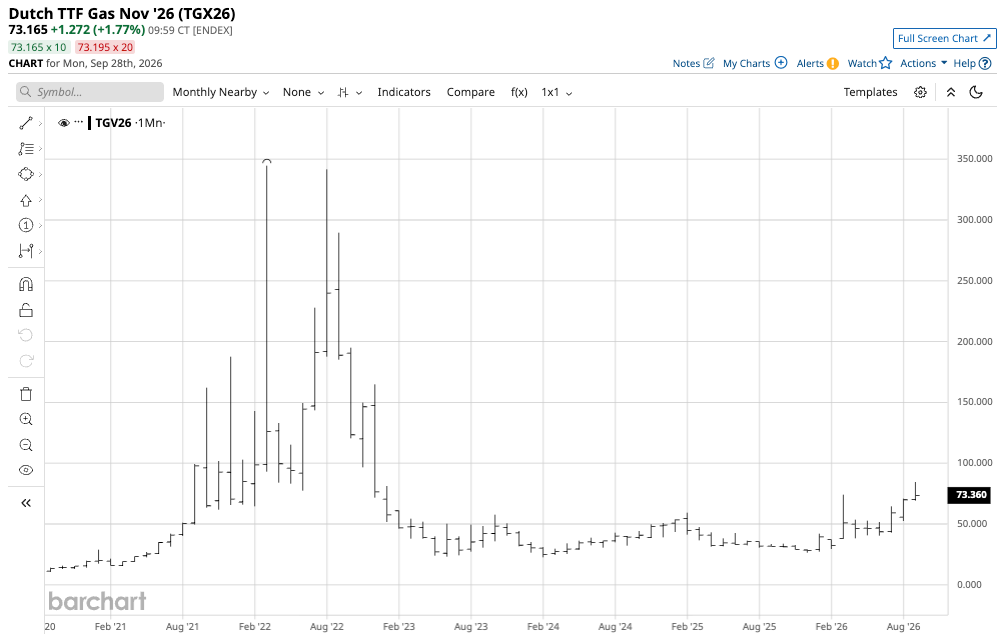
The monthly chart shows that Dutch natural gas futures prices at 73.17 on September 28, 2026, are significantly higher than the September 2025 high of 33.44 euros per MWh.
European prices have risen as supply issues from Russia and Qatar could push Western Europe to increase its demand for U.S. LNG. The bottom line is that “Europe is facing a challenging summer with regard to gas storage supplies and increased LNG imports will be needed.” Meanwhile, EU gas storage levels were at 28% at the start of April 2026, the lowest level in four years.
U.S. inventories are not keeping pace with last year’s level
While Europe faces a significant natural gas shortage this winter, U.S. inventories remain stable.
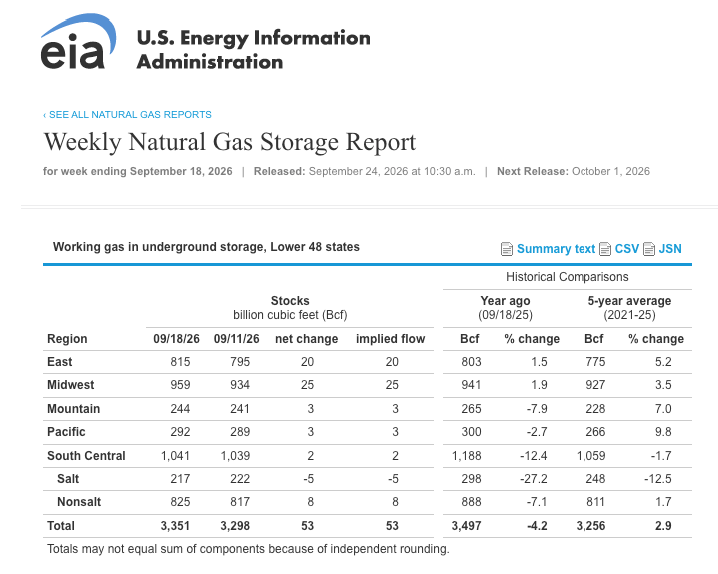
The chart shows that at 3.351 trillion cubic feet for the week ending September 18, U.S. natural gas inventories were ample at 2.9% above the five-year average in mid-September but 4.2% below the level at the same time in 2025.
Time will tell if inventories below last year’s level, increasing demand for U.S. LNG from Western Europe, and cold temperatures over the 2026/2027 winter will cause U.S. stocks to drop. Stocks began last year’s peak season at 3.96 tcf and fell to 1.829 tcf by the end of the 2025/2026 withdrawal season. These levels will be important to watch over the coming months, as they will indicate whether U.S. natural gas supplies have headed for Europe and even Asia, where prices are substantially higher. If so, U.S. natural gas prices could rally over the coming weeks and months.
The forward curve remains attractive for peak season prices
As the peak heating season runs from November, the futures curve reflects the higher demand and falling inventories over the coming months.
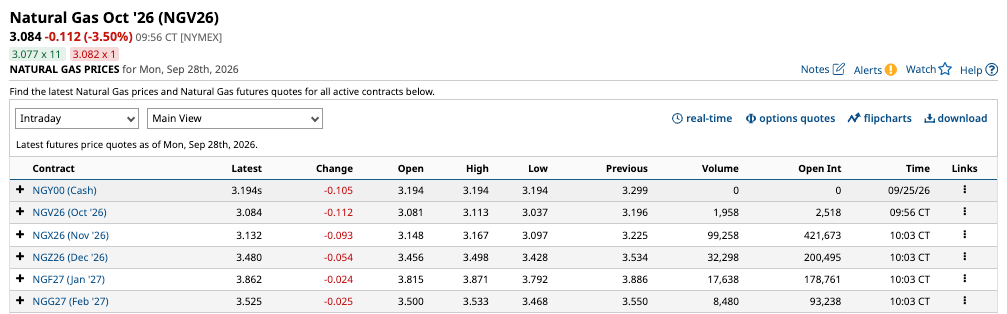
The forward curve shows that the price peaks in January 2027 at $3.862 per MMBtu.
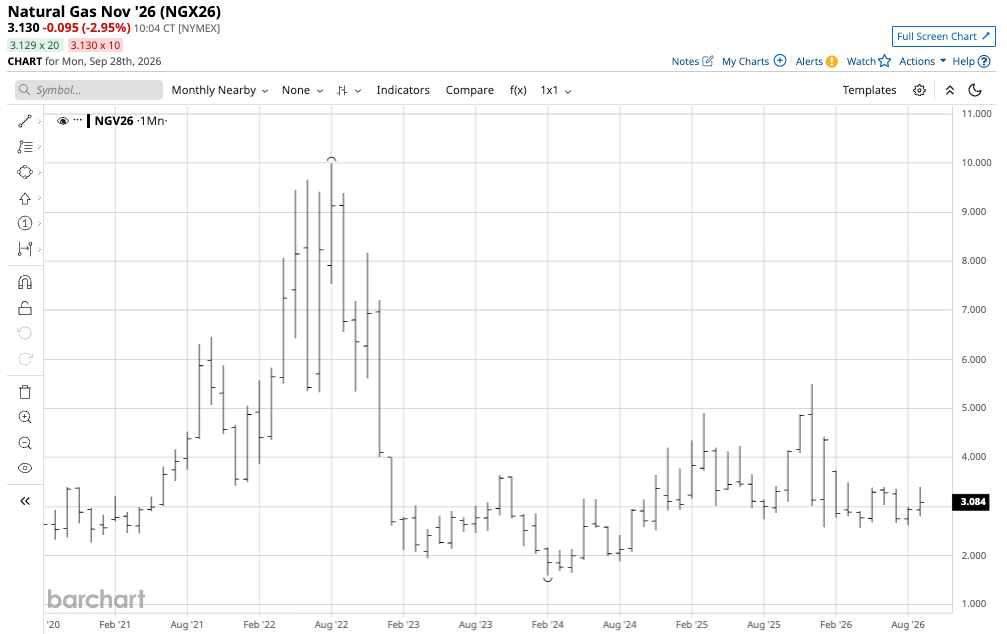
The monthly chart shows that the continuous contract rose to a high of $5.496 in December 2026 and $4.425 per MMBtu in January 2026, considerably higher than the current price of $3.862 for January 2027 delivery.
Natural gas for January 2027 delivery may be inexpensive at below $3.90 per MMBtu.
UNG and BOIL could offer value in September 2026
The most direct route for a U.S. natural gas risk position is the futures and futures options on the CME’s NYMEX division. The futures can be highly volatile, require special trading accounts, and involve leverage. Each U.S. natural gas futures contract contains 10,000 MMBtu. At $3.15 per MMBtu, the current contract value is $31,500. The exchange’s current original margin requirement is $3,636 per contract. A market participant can control $31,500 worth of natural gas on the long or short side for an 11.5% down payment. When equity falls below $3,306 per contract, the exchange requires maintenance margin, and if volatility increases, the exchange will increase original and maintenance margin levels, impacting all risk positions.
Two liquid ETFs track U.S. NYMEX natural gas futures on the upside. The U.S. Natural Gas Fund (UNG) is unleveraged, while the Ultra Bloomberg Natural Gas 2X ETF (BOIL) offers double leverage.
At $10.72 per share, UNG had $563.735 million in assets under management. UNG trades an average of over 23.74 million shares per day and charges a 1.17% management fee.
At $20.97 per share, the leveraged BOIL ETF had $309.536 million in assets under management. BOIL trades an average of over 6 million shares per day and charges a 0.95% management fee. The KOLD ETF is BOIL’s bearish counterpart.
The latest rally in nearby natural gas prices pushed the price up 29.8%, from $2.616 on August 6 to $3.395 on September 24.
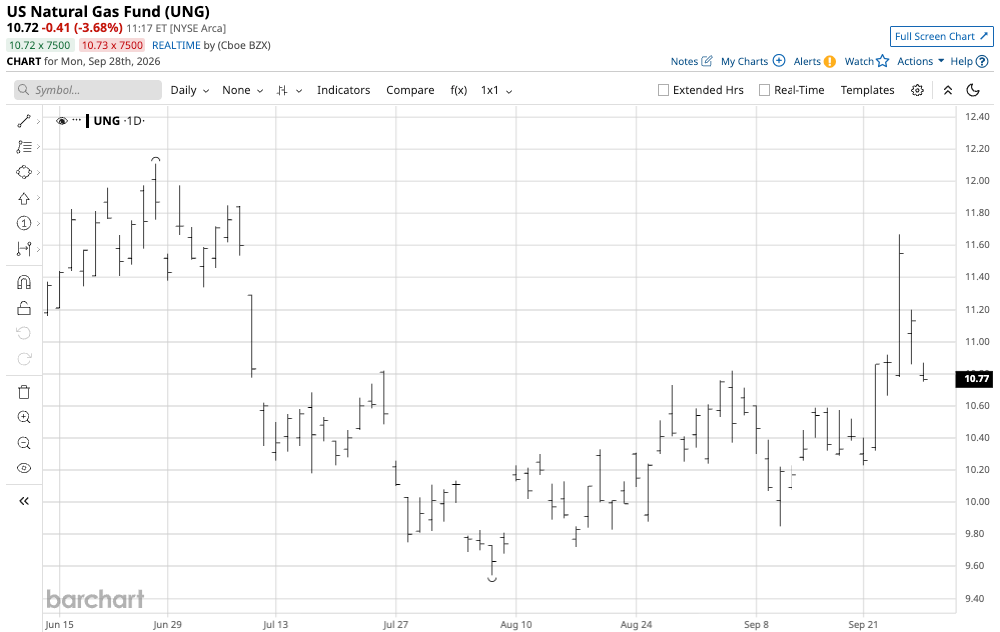
Over the same period, the unleveraged UNG ETF rose 22.3% from $9.54 to $11.67 per share.
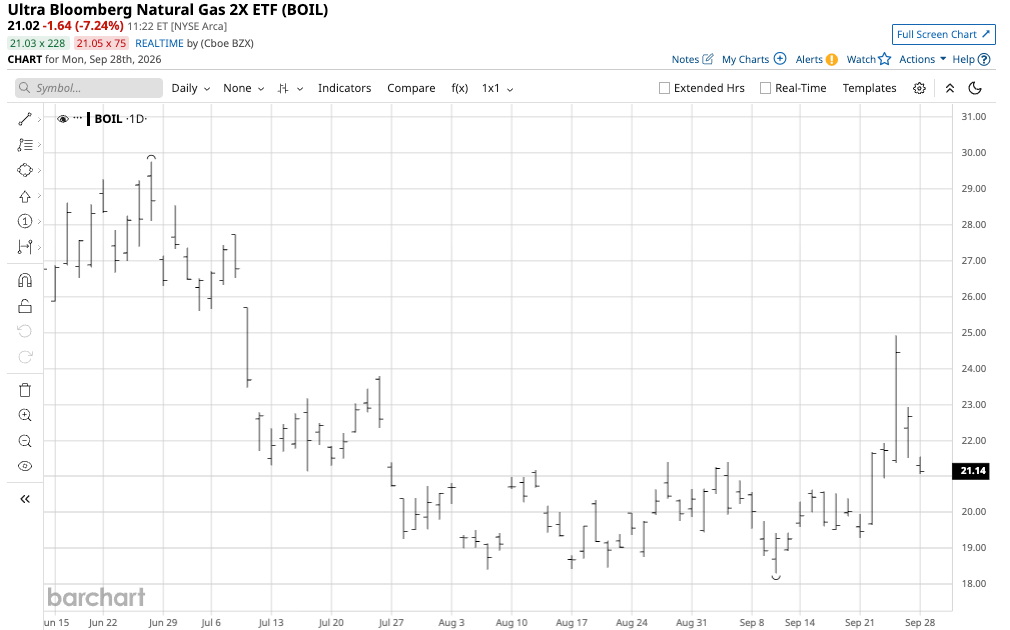
Over the same period, the leveraged BOIL ETF rose 35.4% from $18.41 to $24.92 per share.
One drawback of the natural gas ETFs is that while U.S. natural gas trades around the clock, UNG and BOIL are only available during U.S. stock market hours, so they often miss highs or lows that occur when the stock market is closed.
UNG may be unleveraged, but the natural gas futures market can lose value during roll periods from one active month to the next. BOIL is leveraged and experiences time decay if the natural gas futures move lower or remain stable.
Both UNG and BOIL are volatile ETFs that require careful attention and risk-reward planning. The SEC website highlights the significant risks associated with leveraged ETFs like BOIL and its bearish counterpart KOLD.
I expect a volatile winter season in the natural gas futures market as European shortages could drain U.S. stocks as LNG demand increases. However, the weather and temperatures in the U.S. and Europe from November through February will determine how high natural gas prices can rise. I believe the downside in natural gas prices could be limited over the coming weeks and months, but careful attention to risk-reward dynamics is always advisable in the volatile energy commodity.
On the date of publication, Andrew Hecht did not have (either directly or indirectly) positions in any of the securities mentioned in this article. All information and data in this article is solely for informational purposes. For more information please view the Barchart Disclosure Policy here.