


Undervalued Small Caps With Insider Action In Asian Markets For September 2026
As Asian markets navigate the complexities of inflation concerns and fluctuating interest rates, small-cap stocks have experienced varied performance amid broader economic shifts. Despite these challenges, certain small-cap companies in Asia have caught investors' attention due to insider actions that suggest potential value opportunities. In such a dynamic environment, identifying stocks with solid fundamentals and active insider involvement can be crucial for those seeking to capitalize on market inefficiencies.
Top 10 Undervalued Small Caps With Insider Buying In Asia
| Name | PE | PS | Discount to Fair Value | Value Rating |
|---|---|---|---|---|
| Q Technology (Group) | 3.6x | 0.2x | 42.71% | ★★★★★☆ |
| Australian Finance Group | 7.1x | 0.2x | 27.59% | ★★★★★☆ |
| China Aircraft Leasing Group Holdings | 7.3x | 1.0x | 36.09% | ★★★★★☆ |
| BWP Trust | 6.8x | 13.3x | 22.16% | ★★★★★☆ |
| DMCI Holdings | 6.0x | 0.9x | 42.84% | ★★★★☆☆ |
| Aztech Global | 12.3x | 1.0x | -96.80% | ★★★★☆☆ |
| Domino's Pizza Enterprises | NA | 0.9x | 14.55% | ★★★★☆☆ |
| Citicore Energy REIT | 13.3x | 10.1x | 26.38% | ★★★☆☆☆ |
| China Yongda Automobiles Services Holdings | NA | 0.0x | -53.71% | ★★★☆☆☆ |
| Paragon Care | NA | 0.1x | -8.00% | ★★★☆☆☆ |
Let's take a closer look at a couple of our picks from the screened companies.
HealthCo Healthcare and Wellness REIT (ASX:HCW)
Simply Wall St Value Rating: ★★★☆☆☆
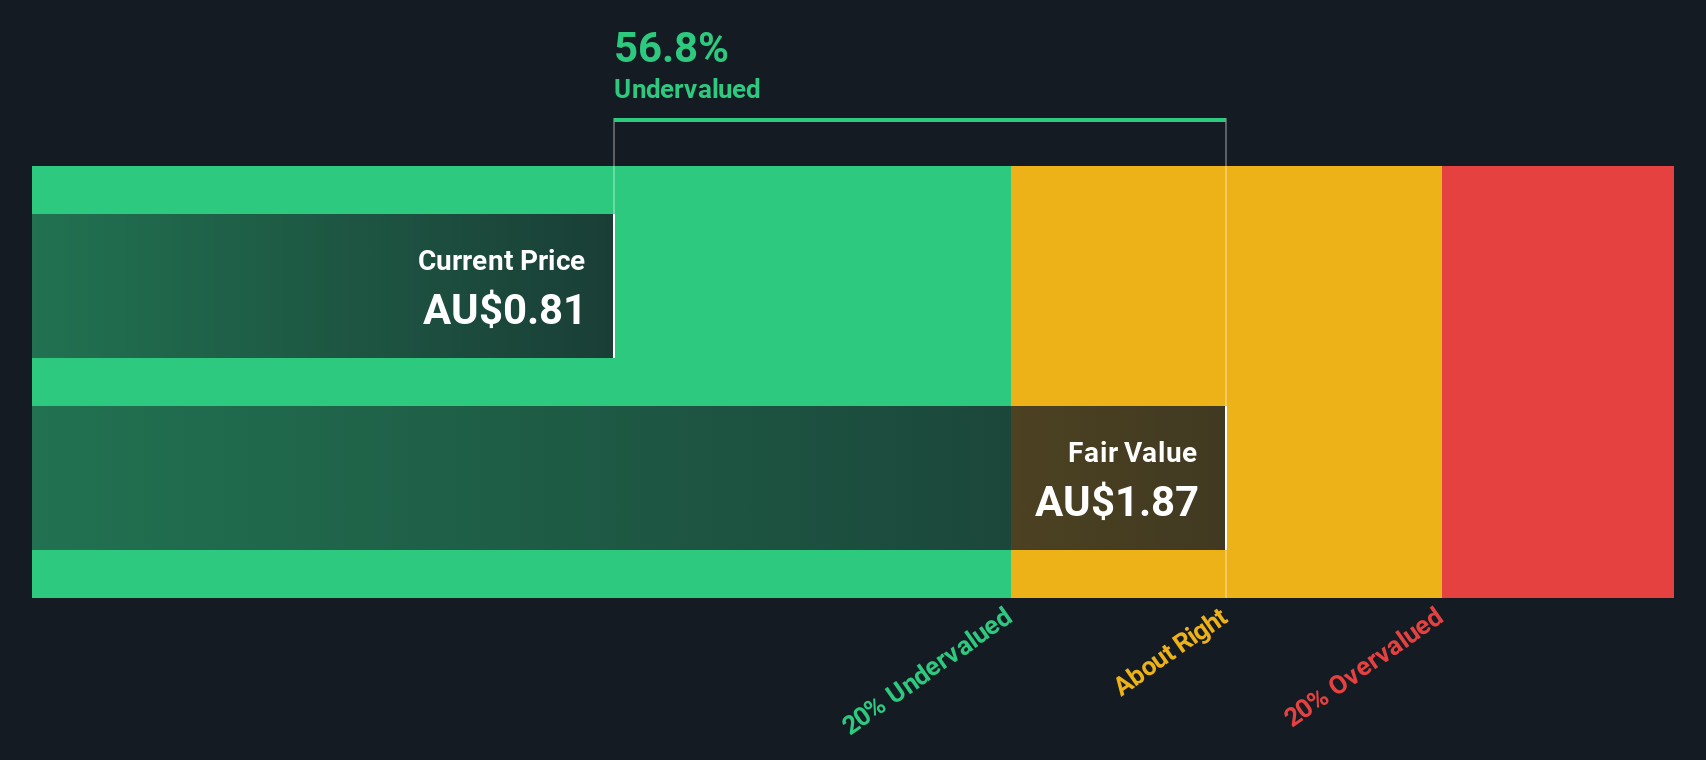
Overview: HealthCo Healthcare and Wellness REIT is a real estate investment trust focused on owning, managing, and developing healthcare and wellness property assets, with a market capitalization of A$1.05 billion.
Operations: HealthCo Healthcare and Wellness REIT generates revenue primarily from its healthcare and wellness properties, with a gross profit margin reaching 77.62% by September 2026. The company faces significant non-operating expenses, which have impacted net income margins negatively in recent periods. Operating expenses are relatively stable at around A$3 million per quarter, contributing to the overall cost structure.
PE: -8.1x
HealthCo Healthcare and Wellness REIT, a small cap stock in Asia, recently reported a net loss of A$49.7 million for the fiscal year ending June 2026, an improvement from A$88.8 million the previous year. Despite lower sales of A$57.2 million compared to last year's A$60.4 million, there's insider confidence with recent share purchases by executives over the past quarter. The company projects earnings growth of 64% annually, although it relies solely on external borrowing for funding.
SHAPE Australia (ASX:SHA)
Simply Wall St Value Rating: ★★★☆☆☆
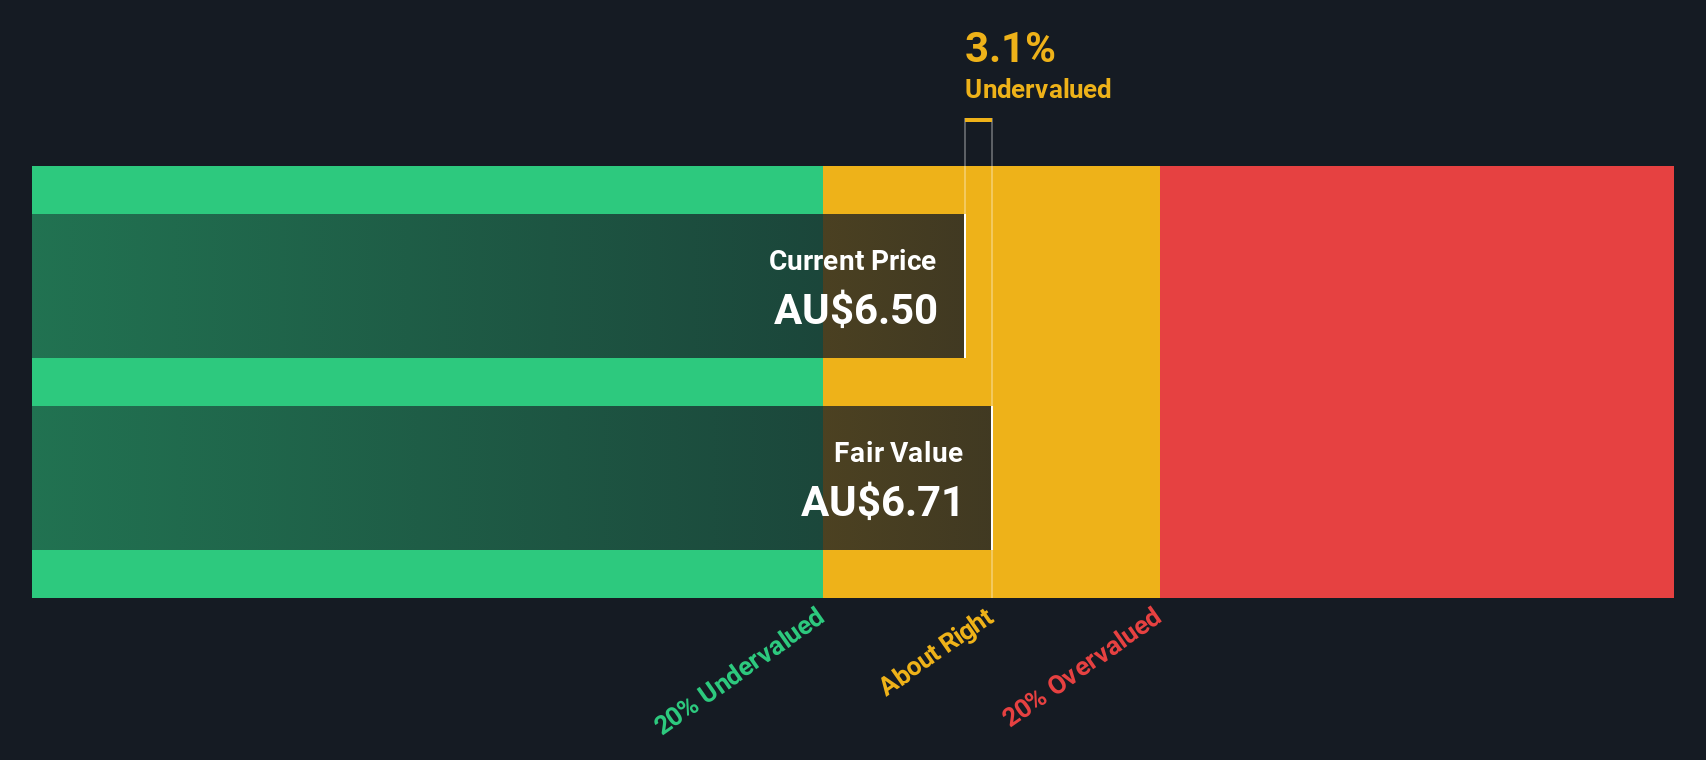
Overview: SHAPE Australia is a company involved in heavy construction, with operations focused on delivering large-scale building projects, and has a market cap of A$0.12 billion.
Operations: SHA generates revenue primarily from its heavy construction segment, amounting to A$1.24 billion. The company's cost of goods sold (COGS) stands at A$1.11 billion, contributing to a gross profit margin of 10.37%. Operating expenses are recorded at A$80.69 million, with general and administrative expenses comprising a significant portion at A$53.34 million. Net income is reported as A$31.74 million, resulting in a net income margin of 2.56%.
PE: 19.4x
SHAPE Australia, a company with external borrowing as its sole funding source, is making strides in the market. Recently added to the S&P Global BMI Index on September 5, 2026, it reported a significant increase in sales and net income for the fiscal year ending June 30, 2026. Insider confidence is evident with Peter Massey purchasing A$200K worth of shares. The firm is actively pursuing acquisitions that promise higher margins than their business-as-usual operations. Earnings are expected to grow annually by 8.63%.
Q Technology (Group) (SEHK:1478)
Simply Wall St Value Rating: ★★★★★☆
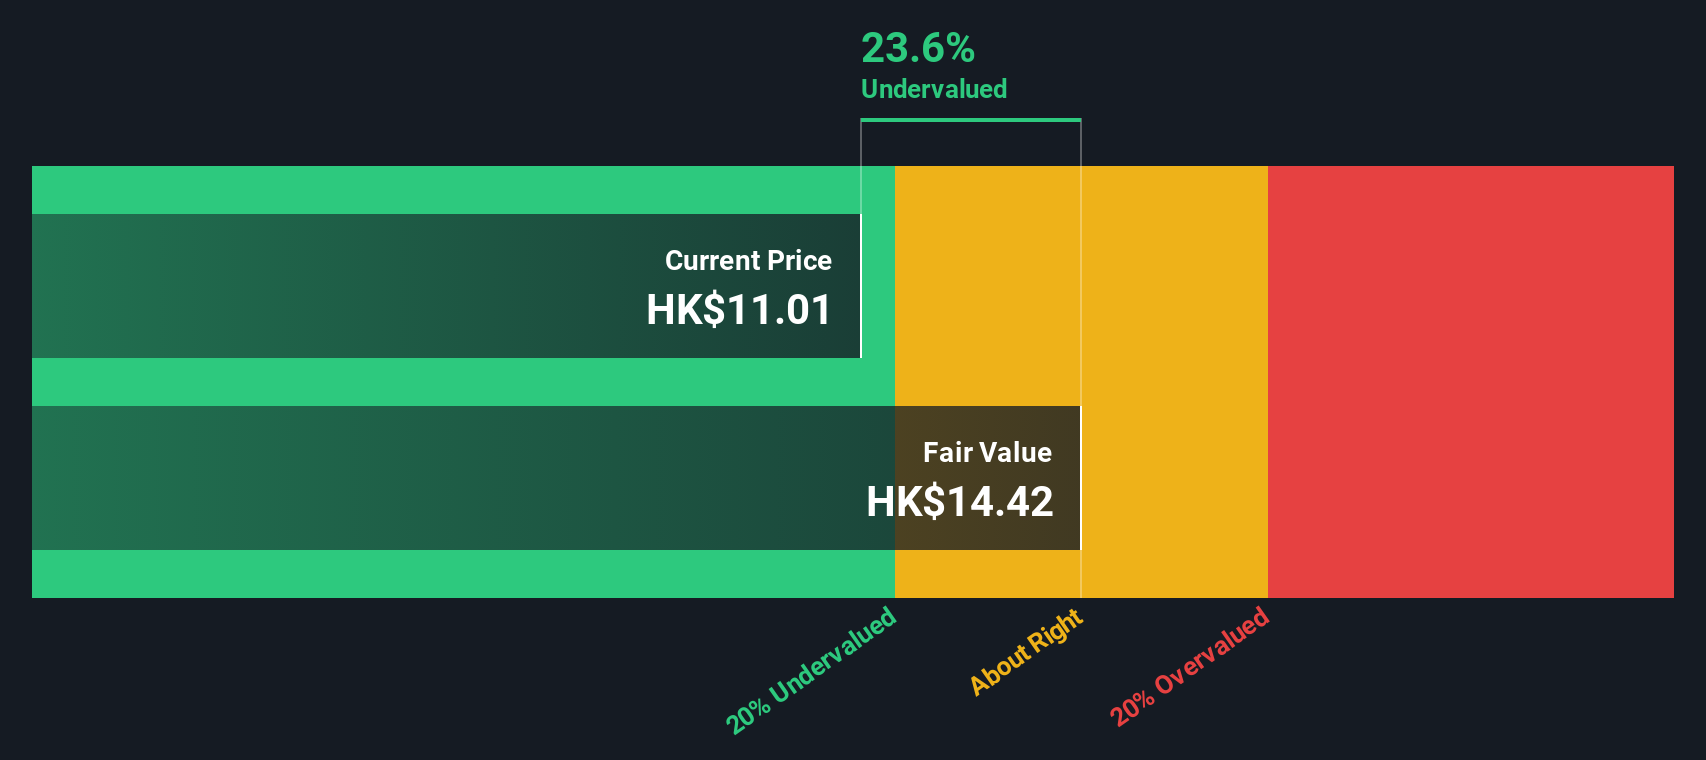
Overview: Q Technology (Group) is a company involved in the design, manufacturing, and sale of camera modules and fingerprint recognition modules with a market capitalization of approximately CN¥6.5 billion.
Operations: Q Technology (Group) primarily generates revenue through its operations, reaching CN¥21.97 billion in the second quarter of 2026. The company's cost of goods sold was CN¥20.35 billion during this period, resulting in a gross profit margin of 7.36%. Operating expenses include significant allocations to R&D and general & administrative activities, impacting overall profitability.
PE: 3.6x
Q Technology (Group) is drawing attention in the Asian small-cap sector due to its mixed financial performance and strategic moves. Despite a decline in net income to CNY 276 million for the half-year ending June 2026, sales increased to CNY 9.92 billion from the previous year. The company maintains investor interest with a HKD 0.15 interim dividend, payable on October 23, 2026. However, earnings are projected to decline by an average of 4.2% annually over the next three years, highlighting potential challenges ahead amidst reliance on external borrowing for funding needs.
- Unlock comprehensive insights into our analysis of Q Technology (Group) stock in this valuation report.
Explore historical data to track Q Technology (Group)'s performance over time in our Past section.
Next Steps
- Embark on your investment journey to our 55 Undervalued Asian Small Caps With Insider Buying selection here.
- Shareholder in one or more of these companies? Ensure you're never caught off-guard by adding your portfolio in Simply Wall St for timely alerts on significant stock developments.
- Unlock the power of informed investing with Simply Wall St, your free guide to navigating stock markets worldwide.
Want To Explore Some Alternatives?
- Explore high-performing small cap companies that haven't yet garnered significant analyst attention.
- Fuel your portfolio with companies showing strong growth potential, backed by optimistic outlooks both from analysts and management.
- Find companies with promising cash flow potential yet trading below their fair value.
This article by Simply Wall St is general in nature. We provide commentary based on historical data and analyst forecasts only using an unbiased methodology and our articles are not intended to be financial advice. It does not constitute a recommendation to buy or sell any stock, and does not take account of your objectives, or your financial situation. We aim to bring you long-term focused analysis driven by fundamental data. Note that our analysis may not factor in the latest price-sensitive company announcements or qualitative material. Simply Wall St has no position in any stocks mentioned.
Have feedback on this article? Concerned about the content? Get in touch with us directly. Alternatively, email editorial-team@simplywallst.com