


Is New Equity ETFs Altering The Investment Case For T. Rowe Price (TROW)?
- T. Rowe Price Group recently launched three fully transparent, actively managed equity ETFs on NASDAQ, targeting biotech (TDNA), U.S. small caps (TSEE), and U.S. mid caps (TMID), with expense ratios between 0.47% and 0.59%.
- The new ETFs bring the lineup to 38 funds this year and reflect T. Rowe Price Group’s efforts to broaden its products while addressing fee pressure and client demand for tax-efficient, flexible vehicles.
- We will now look at how T. Rowe Price Group’s expanded active ETF lineup could influence its investment narrative and future asset mix.
T. Rowe Price Group Investment Narrative Recap
To own T. Rowe Price Group, you need to be comfortable with an asset manager that still leans heavily on active investing while trying to meet client demand for lower fees and more flexible vehicles. The near term story orbits around whether it can steady organic flows and keep earnings resilient as clients compare fees, performance, and product breadth.
The biggest operational swing factor right now is how effectively T. Rowe Price Group broadens its ETF and retirement platforms without eroding profitability through fee compression. The key risk is persistent outflows from higher fee products that are not offset by new assets into lower fee ETFs and other vehicles, which would pressure margins.
The fresh trio of active ETFs in biotech, U.S. small caps, and mid caps is the clearest operational move tied to that catalyst. These launches expand a lineup that already spans fixed income, multi asset, digital assets, and thematic approaches, all built on the group’s existing research engine and trading infrastructure.
For you as a shareholder, the question is whether this broadened ETF shelf can help T. Rowe Price Group stabilize asset flows while absorbing the lower fee profile that comes with ETFs. Execution risk sits in distribution, scale, and spreads, since investors trade these funds at market prices and may face commissions and bid ask costs.
T. Rowe Price Group's current narrative assumes revenue grows at 4.4% a year, with earnings rising from $2.0b today to $2.6b by 2029, a $0.6b increase, along with a forecast revenue base of $8.4b and earnings of $2.6b in that same 2029 estimate year.
Uncover why T. Rowe Price Group's fair value indicates a 4% potential upside to its current price that could narrow quickly.
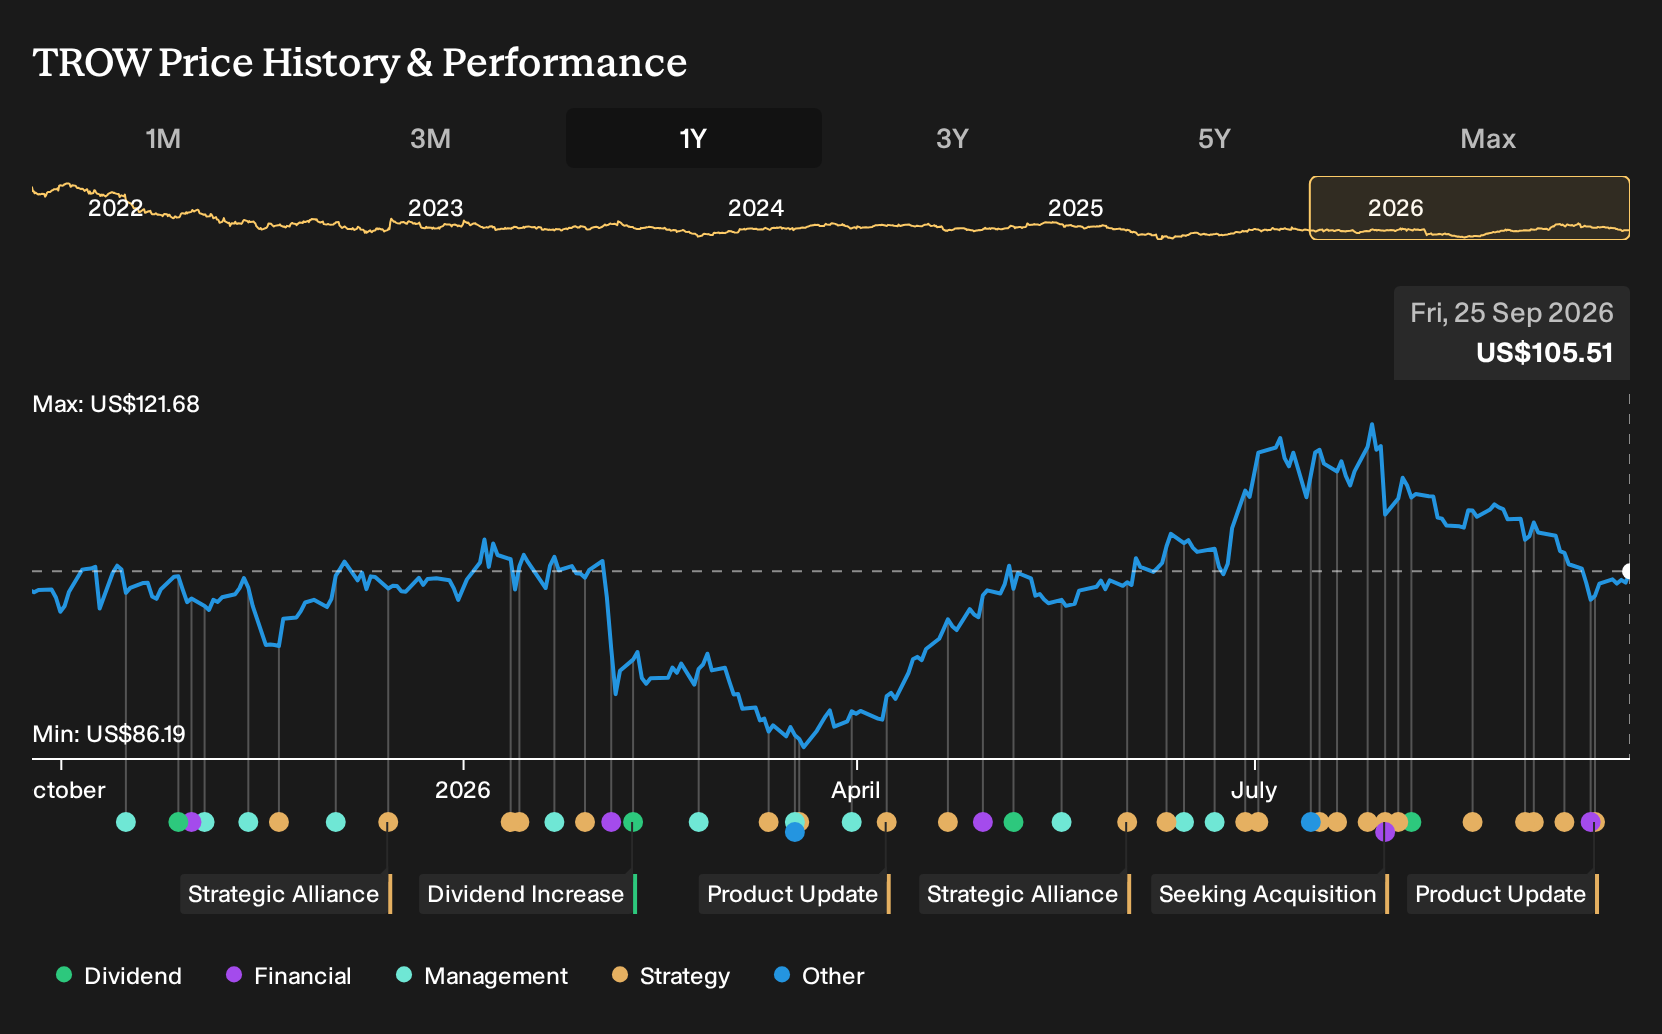
Exploring Other Perspectives
Some of the most optimistic analysts already framed T. Rowe Price Group’s ETF and alternatives push as the real story, even before these latest launches. They were modeling roughly 2.6% annual revenue growth and flat earnings around US$2.2b by 2029. You can treat this new ETF batch as a fresh test of that upbeat view.
Explore 4 other T. Rowe Price Group fair value estimates, including one that suggests as much as 82% upside from the current price!
Reach Your Own Conclusion
Don't just follow the ticker. Dig into the data and build a conviction that's truly your own.
- A great starting point for your T. Rowe Price Group research is our analysis highlighting 3 key rewards and 1 important warning sign that could impact your investment decision.
- See our latest analysis for T. Rowe Price Group. The report includes a comprehensive fundamental analysis summarized in a single visual, the Snowflake, making it easy to evaluate T. Rowe Price Group's overall financial health at a glance.
Looking for more T. Rowe Price Group style ideas?
If the T. Rowe Price Group story has you thinking about where else disciplined research and clear fundamentals might matter, it can help to scan a wider opportunity set using the Simply Wall St Screener.
- For readers who want potential mispricings with solid quality filters, start with a focused set of 32 high quality undervalued stocks that line up strong fundamentals with a more modest valuation profile.
- If resilience matters most to you, filter for 30 resilient stocks with low risk scores that score well on balance sheet strength and business stability.
- Prefer companies that are financially robust and not over-stretched, but still under the radar, by screening through 16 high quality undiscovered gems with healthy fundamentals and room for the story to develop.
This article by Simply Wall St is general in nature. We provide commentary based on historical data and analyst forecasts only using an unbiased methodology and our articles are not intended to be financial advice. It does not constitute a recommendation to buy or sell any stock, and does not take account of your objectives, or your financial situation. We aim to bring you long-term focused analysis driven by fundamental data. Note that our analysis may not factor in the latest price-sensitive company announcements or qualitative material. Simply Wall St has no position in any stocks mentioned.
Have feedback on this article? Concerned about the content? Get in touch with us directly. Alternatively, email editorial-team@simplywallst.com