


Flex (FLEX) Moved Higher, What Is Driving Attention Now?
Flex (FLEX) is reshaping its leadership, with Amy B. Schwetz set to become CFO and two experienced industrial executives, George R. Oliver and Mark Eubanks, joining the board. Investors now have fresh governance moves to assess.
Flex shares closed at US$114.68 after a 1-day share price return of 2.03%, adding to a 7-day gain of 5.69%. However, the 90-day share price return is down 28.13% following a very strong year-to-date move of 80.09% and a 1-year total shareholder return of 101.72%. This suggests that recent governance changes and the planned separation of Cloud and Power Infrastructure are being weighed against earlier enthusiasm.
Scan how Flex’s governance reset compares with other manufacturers by reviewing hand-picked list of solid balance sheet and fundamentals (24 results) that are positioned to respond to the same demand for scale, resilience, and execution quality.
Flex now trades well below both analyst targets and simple fair value models after a sharp pullback. The gap is wide. How much of that discount looks justified once you unpack the valuation work behind it?
Most Popular Narrative: 12% Undervalued
Flex is trading at $114.68 against a widely followed narrative fair value of $130.26, so the market price sits at a clear discount to that framework.
Flex is transitioning from a cyclical, low-margin manufacturer into a high-margin, sticky, engineered-solutions partner. It sits squarely at the intersection of three macro trends: the AI infrastructure explosion, global supply chain nearshoring, and energy transition power management.
See why 4 investors see Flex as 12% undervalued.
Result: Fair Value of $130.26 (UNDERVALUED)
Still, Flex’s thesis hinges on a smooth CPI spin and sustained AI infrastructure demand, so any delay, weak post-spin trading, or slowdown in orders could quickly challenge it.
Find out about the key risks to this Flex narrative.
Another Take On Flex’s Valuation
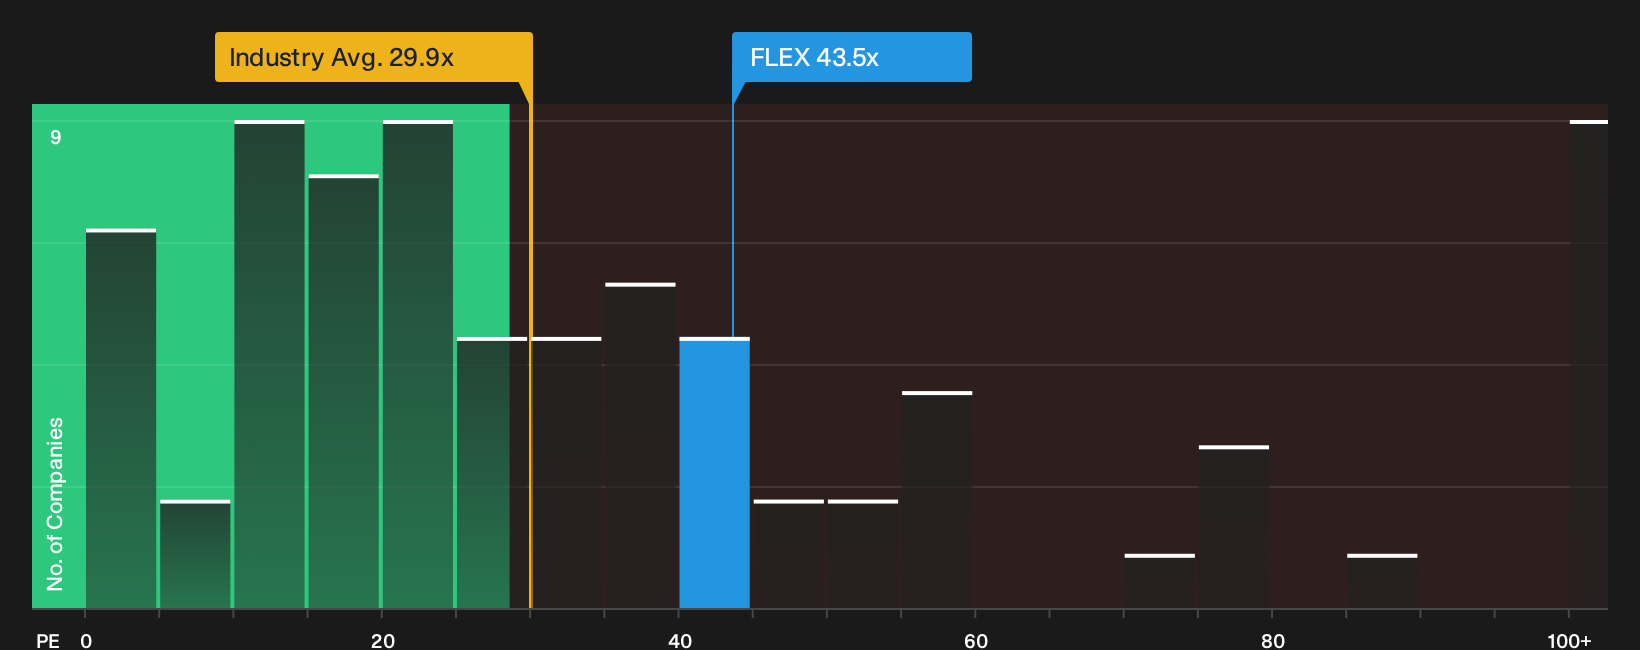
The narrative fair value pegs Flex at $130.26, yet the P/E picture tells a different story. At 43.5x earnings, the stock trades well above the US Electronic industry on 29.9x and peers on 39x, even though the fair ratio suggests 58.8x. That gap indicates both upside potential and valuation risk. Which signal do you rely on more?
See what the numbers say about this price, See what the numbers say about this price — find out in our valuation breakdown.
Next Steps
Mixed on Flex after all this, or leaning one way already, either way move fast, test the thesis against your own research, and weigh the 4 key rewards and 1 important warning sign.
Looking for more Flex-sized investment ideas?
Do not stop with Flex. Put the same energy into finding your next opportunity by scanning focused lists that highlight quality, price, and durability across the market.
- Target potential bargains by reviewing a curated 32 high quality undervalued stocks that combine solid fundamentals with prices that may not fully reflect those qualities.
- Build steadier income by assessing a focused group of 8 dividend fortresses that pair higher yields with balance sheets you can scrutinize in one place.
- Protect your downside by zeroing in on a 30 resilient stocks with low risk scores that screens for resilience so you are not guessing where the next shock might land.
This article by Simply Wall St is general in nature. We provide commentary based on historical data and analyst forecasts only using an unbiased methodology and our articles are not intended to be financial advice. It does not constitute a recommendation to buy or sell any stock, and does not take account of your objectives, or your financial situation. We aim to bring you long-term focused analysis driven by fundamental data. Note that our analysis may not factor in the latest price-sensitive company announcements or qualitative material. Simply Wall St has no position in any stocks mentioned.
Have feedback on this article? Concerned about the content? Get in touch with us directly. Alternatively, email editorial-team@simplywallst.com