


JFE Holdings (TSE:5411) Following Chiba Typhoon Disruption, Is The Valuation Still About Right?
JFE Holdings (TSE:5411) is back in focus after heavy rain and a typhoon cut crude steel output at its Chiba plant, with management highlighting potential effects on production and earnings.
Recent trading reflects that uncertainty. JFE Holdings’ share price has eased over the past week but still shows a 19.26% 90 day share price return, while the 5 year total shareholder return of 40.51% points to gains built over a longer horizon.
Scan how other steel and materials players are priced and positioned by running the curated list of solid balance sheet and fundamentals (22 results) alongside JFE Holdings after this production setback.
JFE Holdings trades only slightly below analyst targets, even after the Chiba disruption pulled the share price back. Is this a modest discount supported by solid fundamentals, or a warning that the market’s caution deserves more weight?
Price-to-earnings of 12.5x for JFE Holdings: Is it justified?
On simple earnings terms, JFE Holdings trades on a P/E of 12.5x at a last close of ¥1,845.5, which leaves the stock priced roughly in line with peers rather than clearly cheap or expensive.
The P/E ratio compares what investors pay today for each unit of earnings. For a cyclical materials group like JFE Holdings, that matters because profits can move with steel demand, input costs, and capacity usage, so the multiple gives a quick read on how much optimism is embedded in current earnings.
Against the broader Japan market, that 12.5x P/E sits below the 14.1x average. Against direct Metals and Mining peers, however, the stock trades richer than the 11.2x sector average, even though the firm’s forecast revenue growth of 2.5% a year is slower than the wider market and its forecast return on equity of 5.3% is low, so the market is assigning a higher tag to its earnings than to many competitors.
The fair-value work based on a P/E of 17.7x points in a different direction. It indicates the current 12.5x multiple is materially lower than the level the fair ratio suggests the market could move toward if sentiment and fundamentals line up.
Explore the SWS fair ratio for JFE Holdings.
Result: Price-to-earnings of 12.5x (ABOUT RIGHT)
Still, the Chiba disruption and a relatively low forecast return on equity of 5.3% could both pressure sentiment if operational recovery or capital efficiency disappoint investors.
Find out about the key risks to this JFE Holdings narrative.
Another view on JFE Holdings’ value
The P/E story presents JFE Holdings as roughly fairly tagged, but the SWS DCF model points a different way. On that measure, the current price of ¥1,845.5 sits above an estimated future cash flow value of ¥1,237.3, which screens as overvalued rather than discounted. That leaves a simple question for you: which signal matters more, earnings or cash generation?
Look into how the SWS DCF model arrives at its fair value.
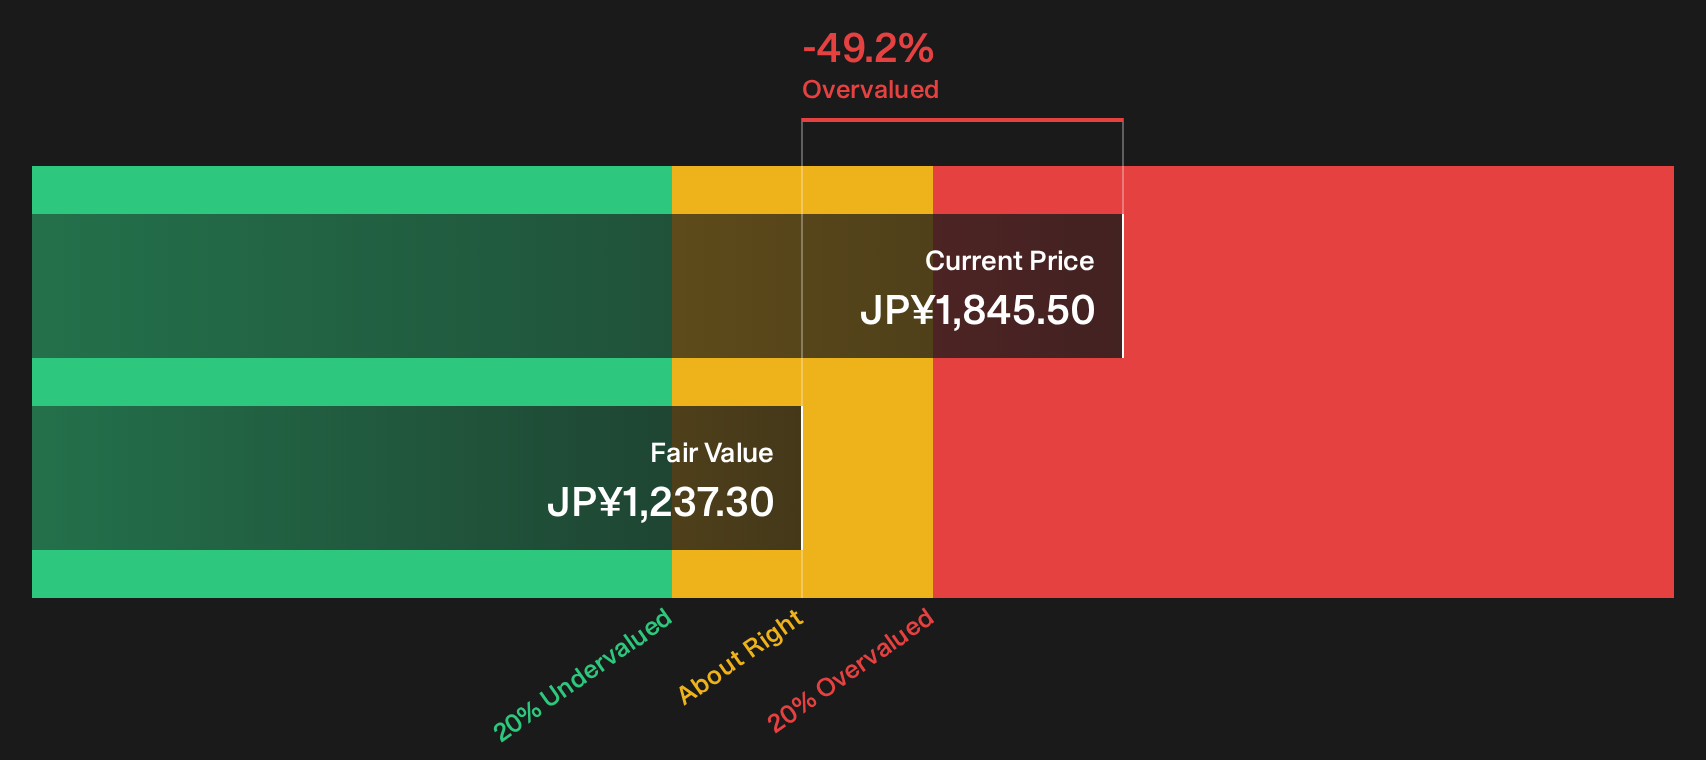
Simply Wall St performs a discounted cash flow (DCF) on every stock in the world every day (check out JFE Holdings for example). We show the entire calculation in full. You can track the result in your watchlist or portfolio and be alerted when this changes, or use our stock screener to discover 19 high quality undervalued stocks. If you save a screener we even alert you when new companies match - so you never miss a potential opportunity.
Next Steps
Mixed signals can feel messy, especially with JFE Holdings after the Chiba issue and conflicting valuation models, so move fast and test the data yourself. Weigh both the potential risks and the upside case by checking the 3 key rewards and 2 important warning signs.
Looking for more JFE Holdings style investment ideas?
Do not stop with JFE Holdings. Broaden your watchlist with a few focused stock ideas that match different aims, so you are not relying on a single story.
- Target potential value upside by scanning the 19 high quality undervalued stocks that match your quality and pricing checklist.
- Strengthen your income stream by reviewing the 14 dividend fortresses so you are not leaving reliable yield ideas on the table.
- Prioritise resilience by filtering for the 21 resilient stocks with low risk scores that can help steady your portfolio when conditions change.
This article by Simply Wall St is general in nature. We provide commentary based on historical data and analyst forecasts only using an unbiased methodology and our articles are not intended to be financial advice. It does not constitute a recommendation to buy or sell any stock, and does not take account of your objectives, or your financial situation. We aim to bring you long-term focused analysis driven by fundamental data. Note that our analysis may not factor in the latest price-sensitive company announcements or qualitative material. Simply Wall St has no position in any stocks mentioned.
Have feedback on this article? Concerned about the content? Get in touch with us directly. Alternatively, email editorial-team@simplywallst.com