


Brookfield Business (TSX:BBUC) Looks Cheap On Sales, Is The Upside Already Priced In?
Brookfield Business (TSX:BBUC) has drawn fresh attention after recent trading left the share price at CA$35.96, with the stock down about 8% over the past month and 18% over the past 3 months.
Recent trading has been choppy for Brookfield Business, with the 1-day share price return of 1.58% and a flat 7-day move set against a 30-day share price decline of 8.01% and a year-to-date fall of 27.31%. The 3-year total shareholder return of 79.92% contrasts sharply with the weaker 1-year total shareholder return of 19.13%, suggesting earlier momentum has faded and investor focus has shifted toward reassessing risk and valuation.
Scan beyond Brookfield Business and compare what the market is pricing into other beaten down outfits using the 5 high quality undervalued stocks right now.
For Brookfield Business, a 3 year gain sits against a weaker recent stretch and a loss making bottom line. Is the bulk of the opportunity already realised, or do the current figures still hint at meaningful upside ahead?
Preferred price-to-sales multiple for Brookfield Business: Is it justified?
On simple sales-based metrics, Brookfield Business looks cheap. The stock trades on a P/S ratio of 0.2x at a last close of CA$35.96, which is well below both the global Industrials average of 0.8x and a peer group average of 1.4x.
The P/S ratio compares the market value of the equity to the revenue the business brings in. For a diversified private equity operator like Brookfield Business, which generated CA$26.9b of revenue while still reporting a net loss of CA$55m, a sales multiple can highlight what investors are willing to pay for each dollar of turnover when earnings are not yet positive.
That gap to industry and peer averages is wide, so the market is assigning Brookfield Business a clear discount relative to many Industrials stocks. The fair P/S ratio estimate used by Simply Wall St is effectively at 0x. This implies the SWS fair value model is much more cautious and points to a level the market could potentially move toward if sentiment stays focused on the lack of profitability and pressure on revenue.
Explore the SWS fair ratio for Brookfield Business.
Result: Price-to-sales ratio of 0.2x (OVERVALUED).
Still, the annual revenue contraction of 152%, alongside a reported net loss of CA$55m, leaves Brookfield Business exposed if market patience for turnarounds fades.
Find out about the key risks to this Brookfield Business narrative.
Another view on Brookfield Business using our DCF model
While the low P/S ratio hints at value, our DCF model points the other way. On Simply Wall St estimates, Brookfield Business at CA$35.96 trades well above an implied future cash flow value of CA$14.11, which, on this method, suggests that the shares may be overvalued and raises the question of which signal you trust more.
Look into how the SWS DCF model arrives at its fair value.
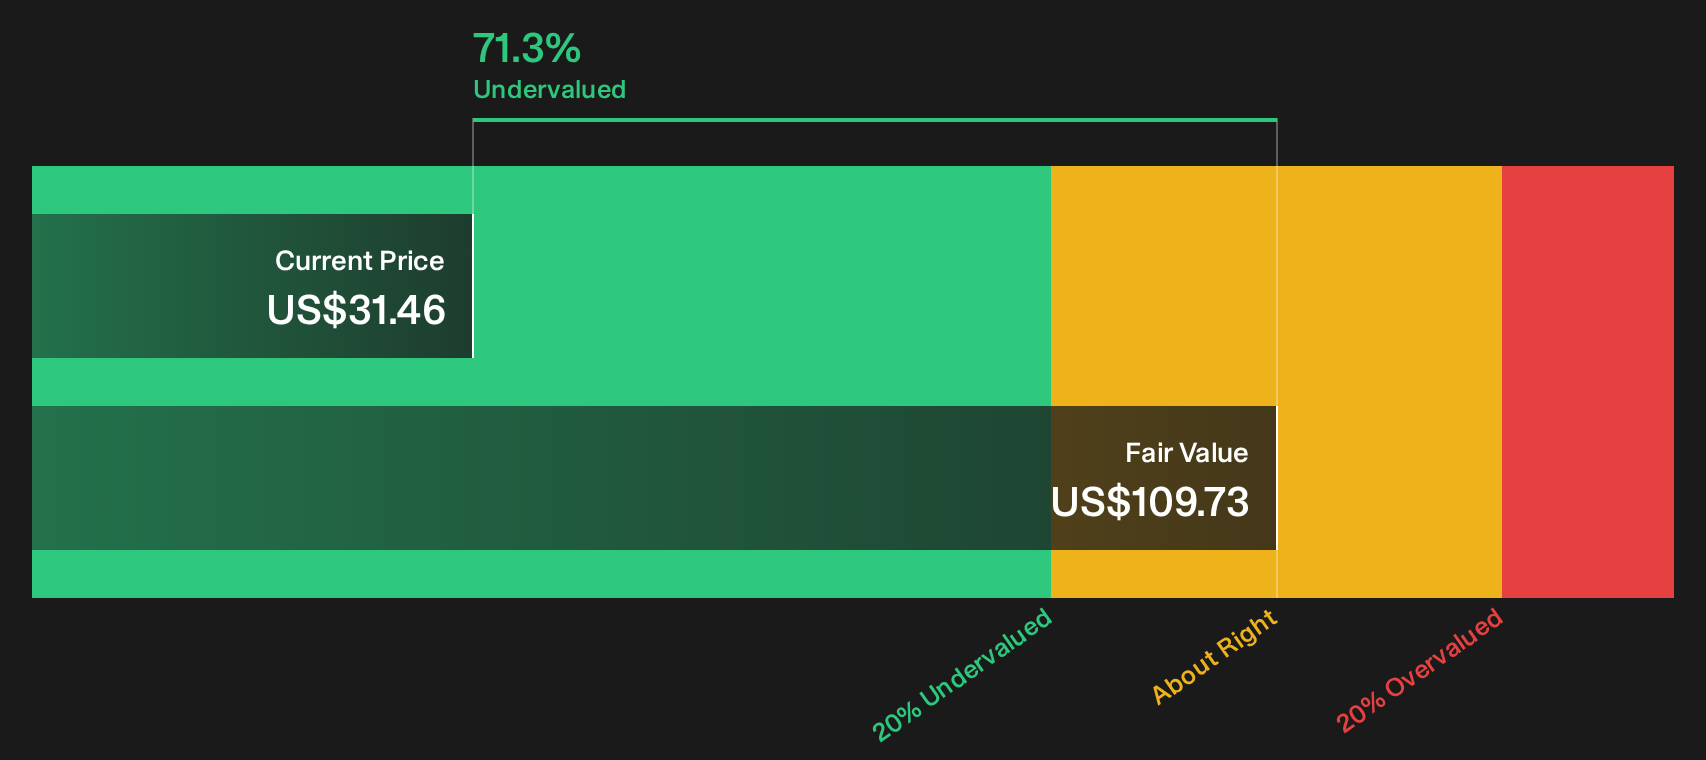
Simply Wall St performs a discounted cash flow (DCF) on every stock in the world every day (check out Brookfield Business for example). We show the entire calculation in full. You can track the result in your watchlist or portfolio and be alerted when this changes, or use our stock screener to discover 5 high quality undervalued stocks. If you save a screener we even alert you when new companies match - so you never miss a potential opportunity.
Next Steps
Mixed signals around Brookfield Business can feel confusing, so rely on the numbers rather than the noise and move quickly to build your own view using the 2 important warning signs.
Looking for more investment ideas beyond Brookfield Business?
If Brookfield Business has you rethinking your approach, use the Simply Wall St Screener to quickly surface other opportunities that match your own criteria and risk comfort.
- Target resilient cash generators by scanning a list of solid balance sheet and fundamentals (7 results) that can help you stress test ideas before committing capital.
- Spot potential market mispricings and sharpen your watchlist by zeroing in on a 5 high quality undervalued stocks that fit stricter fundamentals.
- Hunt for tomorrow's potential standouts early by filtering a 9 high quality undiscovered gems before attention and liquidity catch up.
This article by Simply Wall St is general in nature. We provide commentary based on historical data and analyst forecasts only using an unbiased methodology and our articles are not intended to be financial advice. It does not constitute a recommendation to buy or sell any stock, and does not take account of your objectives, or your financial situation. We aim to bring you long-term focused analysis driven by fundamental data. Note that our analysis may not factor in the latest price-sensitive company announcements or qualitative material. Simply Wall St has no position in any stocks mentioned.
Have feedback on this article? Concerned about the content? Get in touch with us directly. Alternatively, email editorial-team@simplywallst.com