


First Bancorp (FBNC) Just Gave Investors Something To Think About
First Bancorp (FBNC) has affirmed a cash dividend of $0.24 per share, payable on October 23, 2026, to shareholders on record as of September 30, 2026, reinforcing its ongoing capital return approach.
First Bancorp shares trade at US$63.50, with a 1-day share price return of 1.11% and a year-to-date share price return of 24.73%, while the 3-year total shareholder return of 138.93% points to strong longer run momentum despite a softer 30-day share price move.
Scan for other banks that have similar dividend consistency and multi year return profiles using our curated 8 dividend fortresses.
After a strong three year run and a recent pause, First Bancorp now trades near US$63.50 against analyst targets and intrinsic estimates that sit higher. How far does fair value actually stretch from here?
Price-to-Earnings of 19.8x: Is it justified?
On a simple snapshot, First Bancorp trades on a P/E of 19.8x, which looks rich against many peers even though the share price sits at $63.50 and below several valuation reference points investors may be watching.
The P/E ratio compares what you pay today for each dollar of earnings the bank generates and is a common way to gauge how the market is weighing its profit profile. For a regional lender like First Bancorp, that lens matters because earnings quality, growth expectations, and perceived risk can all feed into how far that multiple stretches.
Recent fundamentals give some context to that premium P/E. Earnings grew 37.1% over the past year and net profit margins are described at 32.3% versus 26.8% previously, which points to a more profitable operation today. Earnings are also expected to grow 24% per year with revenue forecast at 16.8% per year, both ahead of the wider US market according to the provided figures. As a result, the market may be paying up for that growth profile even if the headline multiple looks demanding.
The comparison with the sector is stark. The 19.8x P/E is described as expensive versus the US Banks industry average of 11.6x and also above a fair P/E estimate of 15.8x. That suggests investors are already assigning First Bancorp a much richer tag than the average bank and even above a level that regression-based fair value work implies the ratio could move toward if sentiment or growth expectations cool.
Explore the SWS fair ratio for First Bancorp.
Result: Price-to-Earnings of 19.8x (OVERVALUED).
Still, the First Bancorp story can change quickly if credit quality weakens or if funding costs squeeze that 32.3% net margin that investors are watching.
Find out about the key risks to this First Bancorp narrative.
Another View on First Bancorp’s Value
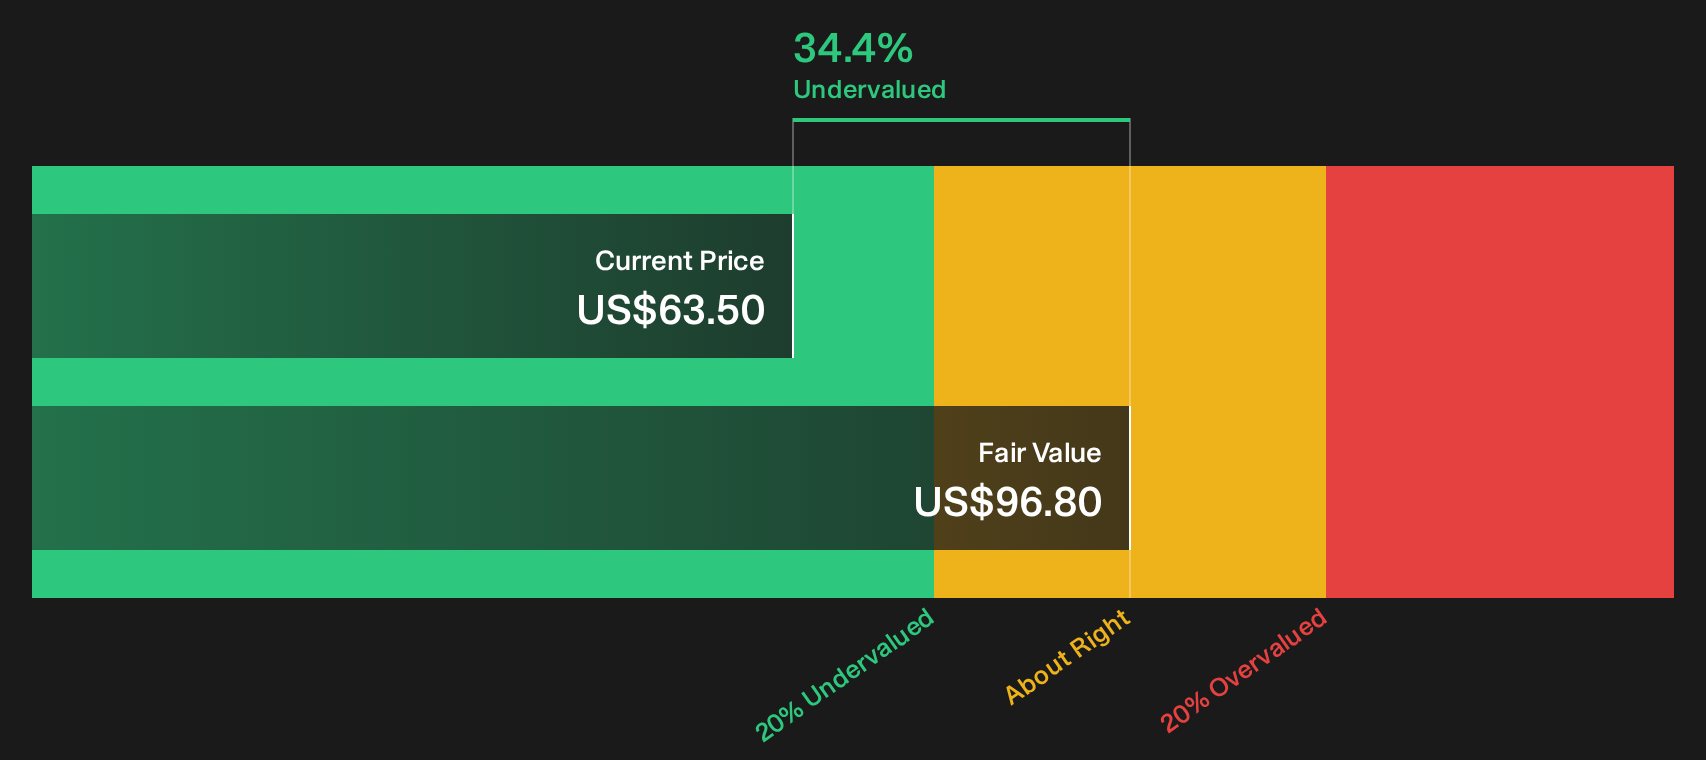
The P/E story paints First Bancorp as expensive, yet the SWS DCF model points the other way. On that lens, FBNC at $63.50 is trading about 34% below an estimated future cash flow value of $96.80. One method signals caution, and the other suggests a discount. Which matters more for you?
Look into how the SWS DCF model arrives at its fair value.
Simply Wall St performs a discounted cash flow (DCF) on every stock in the world every day (check out First Bancorp for example). We show the entire calculation in full. You can track the result in your watchlist or portfolio and be alerted when this changes, or use our stock screener to discover 31 high quality undervalued stocks. If you save a screener we even alert you when new companies match - so you never miss a potential opportunity.
Next Steps
Mixed signals on First Bancorp’s valuation and growth story can be exciting. Move quickly, test the numbers yourself, then weigh them against the 4 key rewards.
Want more ideas beyond First Bancorp?
If First Bancorp has sharpened your thinking on valuation and dividends, do not stop here. Broaden your watchlist today and avoid missing opportunities others only notice later.
- Target resilient balance sheets by scanning companies with strong finances using this curated list of solid balance sheet and fundamentals (24 results).
- Hunt for quality at a discount by reviewing our data driven 31 high quality undervalued stocks before prices move away from you.
- Spot growing income streams by checking which payout focused stocks make it into the 8 dividend fortresses.
This article by Simply Wall St is general in nature. We provide commentary based on historical data and analyst forecasts only using an unbiased methodology and our articles are not intended to be financial advice. It does not constitute a recommendation to buy or sell any stock, and does not take account of your objectives, or your financial situation. We aim to bring you long-term focused analysis driven by fundamental data. Note that our analysis may not factor in the latest price-sensitive company announcements or qualitative material. Simply Wall St has no position in any stocks mentioned.
Have feedback on this article? Concerned about the content? Get in touch with us directly. Alternatively, email editorial-team@simplywallst.com