


JACCS (TSE:8584) Reshapes Credit Screening Operations, Is The Undervaluation Case Compelling?
Restructuring move puts JACCS stock in focus
JACCS (TSE:8584) has put its Medium-Term Business Plan into sharper focus after the board approved an organizational overhaul and workforce rationalization related to its nationwide credit screening operations.
Recent trading has been mixed. JACCS shares are up 1.21% over the last day and 2.04% across the past week. However, the 30 day share price return declined 3.35% and the year to date share price return is down 13.19%. The 1 year total shareholder return fell 10.96% and the 3 year total shareholder return declined 18.35%, even though the 5 year total shareholder return is still up 54.23%. This suggests that enthusiasm has faded from earlier highs as investors weigh the potential cost savings of restructuring against execution risk.
Spot opportunities beyond JACCS by scanning a hand picked group of resilient financials and other operators focused on efficiency gains in our 21 resilient stocks with low risk scores.Bulls see JACCS using this restructuring to lock in a leaner cost base, while bears focus on execution risks and soft recent returns. Which side do the current valuation signals lean toward?
Price-to-earnings of 11.1x for JACCS: Is it justified?
On the numbers, JACCS trades on a P/E of 11.1x, which screens as good value against both its estimated fair P/E of 11.7x and the wider Asian consumer finance average of 12.2x, even though it sits slightly above a narrower peer group on 10.7x.
The P/E multiple compares the current share price with earnings per share. For a consumer finance operator like JACCS, this measure gives a quick read on how the market is pricing its profit stream relative to both its own history and competitors.
Analysts expect JACCS earnings to grow 3.4% per year, which is slower than the wider Japan market forecast of 9% and below the 20% level that would count as high growth. In that context, the current P/E suggests investors are not paying an aggressive premium for those projected profits. The fair P/E estimate of 11.7x indicates the ratio could reasonably sit a little higher than today without looking stretched.
Compared with the Asian consumer finance industry average P/E of 12.2x, JACCS trades at a material discount. At the same time, it is priced slightly higher than its immediate peer group on 10.7x, which points to the market assigning the stock a somewhat higher tag than some rivals while still keeping it below the broader sector benchmark.
Explore the SWS fair ratio for JACCS.
Result: Preferred multiple of 11.1x price-to-earnings (UNDERVALUED).
Still, the recent share price decline over the past year and the discount to the analyst price target suggest that investors may be braced for execution missteps.
Find out about the key risks to this JACCS narrative.
Another view on JACCS using our DCF model
The P/E ratio presents JACCS as modestly cheap, while a different lens offers another perspective. Our DCF model estimates fair value at ¥4,982.63 per share versus a current price of ¥3,750, which suggests JACCS is trading about 24.7% below that estimate. This raises the question of whether the market is being overly cautious on this restructuring story.
Look into how the SWS DCF model arrives at its fair value.
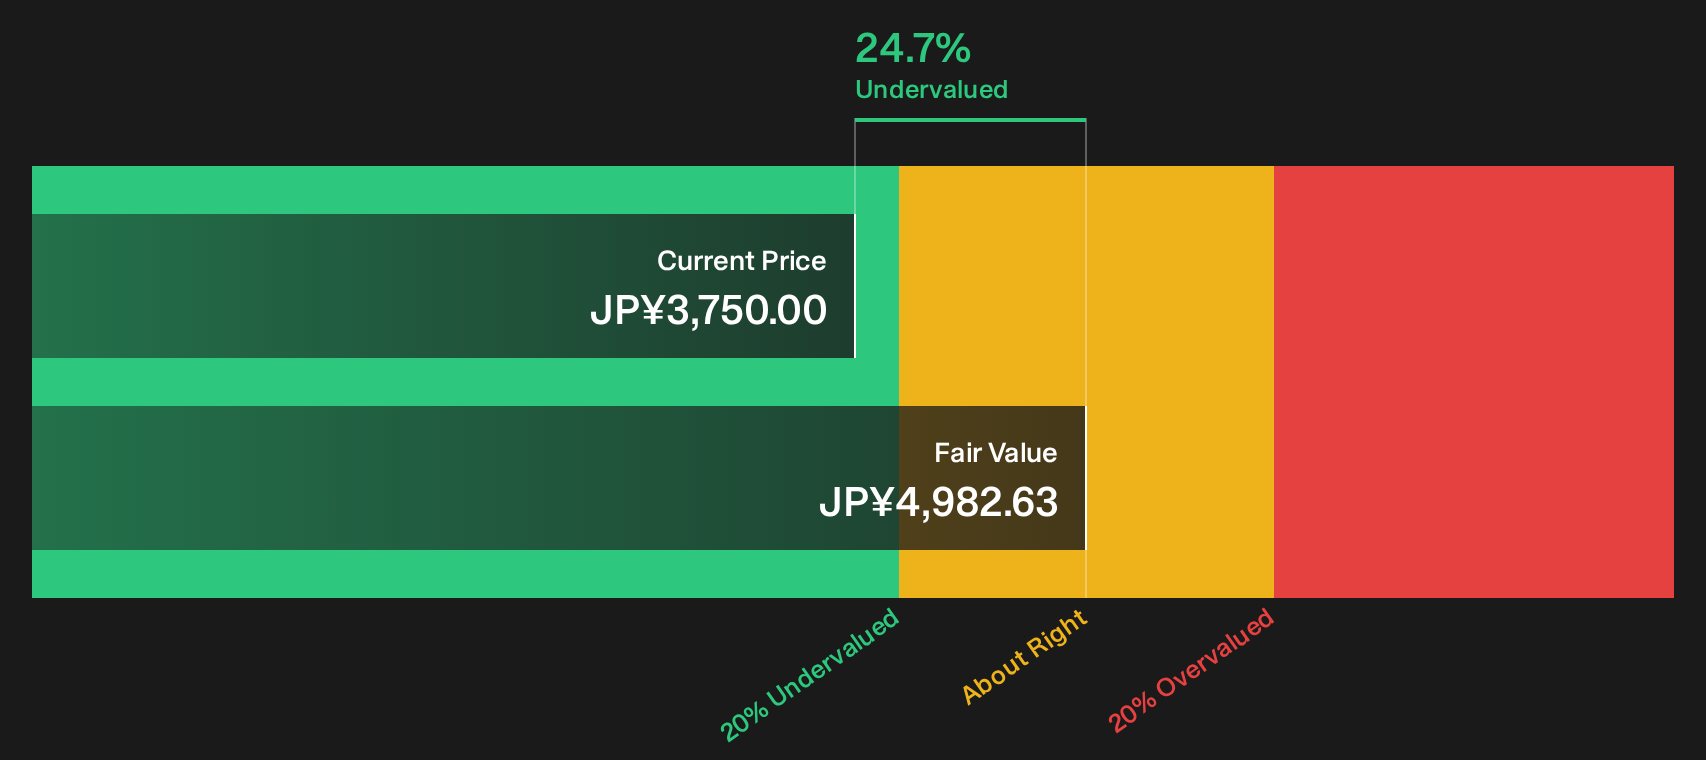
Simply Wall St performs a discounted cash flow (DCF) on every stock in the world every day (check out JACCS for example). We show the entire calculation in full. You can track the result in your watchlist or portfolio and be alerted when this changes, or use our stock screener to discover 18 high quality undervalued stocks. If you save a screener we even alert you when new companies match - so you never miss a potential opportunity.
Next Steps
Unsure whether the recent restructuring headlines around JACCS signal opportunity or risk? Consider acting promptly, review the available data yourself, and weigh both sides. To see a concise summary of the key concerns alongside the potential upsides, start with these 2 key rewards and 2 important warning signs.
Looking for more JACCS style investment ideas?
You have seen how JACCS lines up on valuation signals and restructuring risk. Now put that context to work and widen your opportunity set with a few targeted screens.
Use the Simply Wall St screener to quickly surface other stocks that match the kind of qualities you want to see before committing fresh capital.
- Spot potential mispriced opportunities early by scanning a focused list of companies that screen as attractively valued on quality and fundamentals through our 18 high quality undervalued stocks.
- Strengthen your income stream by reviewing dependable payers with higher yields using our curated set of 14 dividend fortresses.
- Protect your downside first by filtering for companies with resilient finances and cleaner balance sheets inside the list of solid balance sheet and fundamentals (22 results).
This article by Simply Wall St is general in nature. We provide commentary based on historical data and analyst forecasts only using an unbiased methodology and our articles are not intended to be financial advice. It does not constitute a recommendation to buy or sell any stock, and does not take account of your objectives, or your financial situation. We aim to bring you long-term focused analysis driven by fundamental data. Note that our analysis may not factor in the latest price-sensitive company announcements or qualitative material. Simply Wall St has no position in any stocks mentioned.
Have feedback on this article? Concerned about the content? Get in touch with us directly. Alternatively, email editorial-team@simplywallst.com