


First American Financial (FAF) Lifts Its Dividend, Is The Undervalued Case Still Convincing?
Dividend increase sets the tone for income-focused investors
First American Financial (FAF) has lifted its quarterly cash dividend to US$0.61 per share, an 11% rise from US$0.55, payable on October 5, 2026, to shareholders of record on September 28.
First American Financial’s higher dividend comes as the share price has pulled back, with a 1-month share price return down 10.48% and a 7-day move weaker by 8.84%, even though the year-to-date share price return is up 7.40% and the 3-year total shareholder return is 26.71%. This suggests that long-term holders have still seen positive outcomes despite recent pressure.
Scan how First American Financial compares with other income-focused opportunities in our hand picked list of 8 dividend fortresses before the next round of payout updates reshapes the field.
First American Financial now trades well below the average analyst target despite only a modest pullback in longer term returns. Is the market sensibly cautious, or has sentiment pushed the valuation too far down?
Most Popular Narrative: 25% Undervalued
The most followed narrative on First American Financial pegs fair value at $87.67, above the recent $65.60 close. As a result, the gap between sentiment and those assumptions is hard to ignore.
Accelerating adoption and rollout of proprietary technology platforms such as Endpoint and Sequoia has progressed, with automation now covering a rising share of escrow tasks and title decisioning and with management targeting broad branch and national deployment by 2027. This extends the potential for structurally higher net margins as more of the workflow becomes automated.
See why 4 investors see First American Financial as 25% undervalued.
Result: Fair Value of $87.67 (UNDERVALUED)
Still, the First American Financial story can break if residential transaction volumes stay weak or if FHFA title waivers expand and chip away at refinance orders.
Find out about the key risks to this First American Financial narrative.
Another view on First American Financial’s valuation
The first narrative leans on analyst targets that frame First American Financial as undervalued, yet the SWS DCF model points in the opposite direction. On that cash flow view, FAF at $65.60 trades above an estimated future cash flow value of $8.10, which suggests far less room for error if growth or margins disappoint.
Investors weighing these two stories can stress test their own assumptions against the SWS DCF model rather than taking any single fair value at face value. Look into how the SWS DCF model arrives at its fair value.
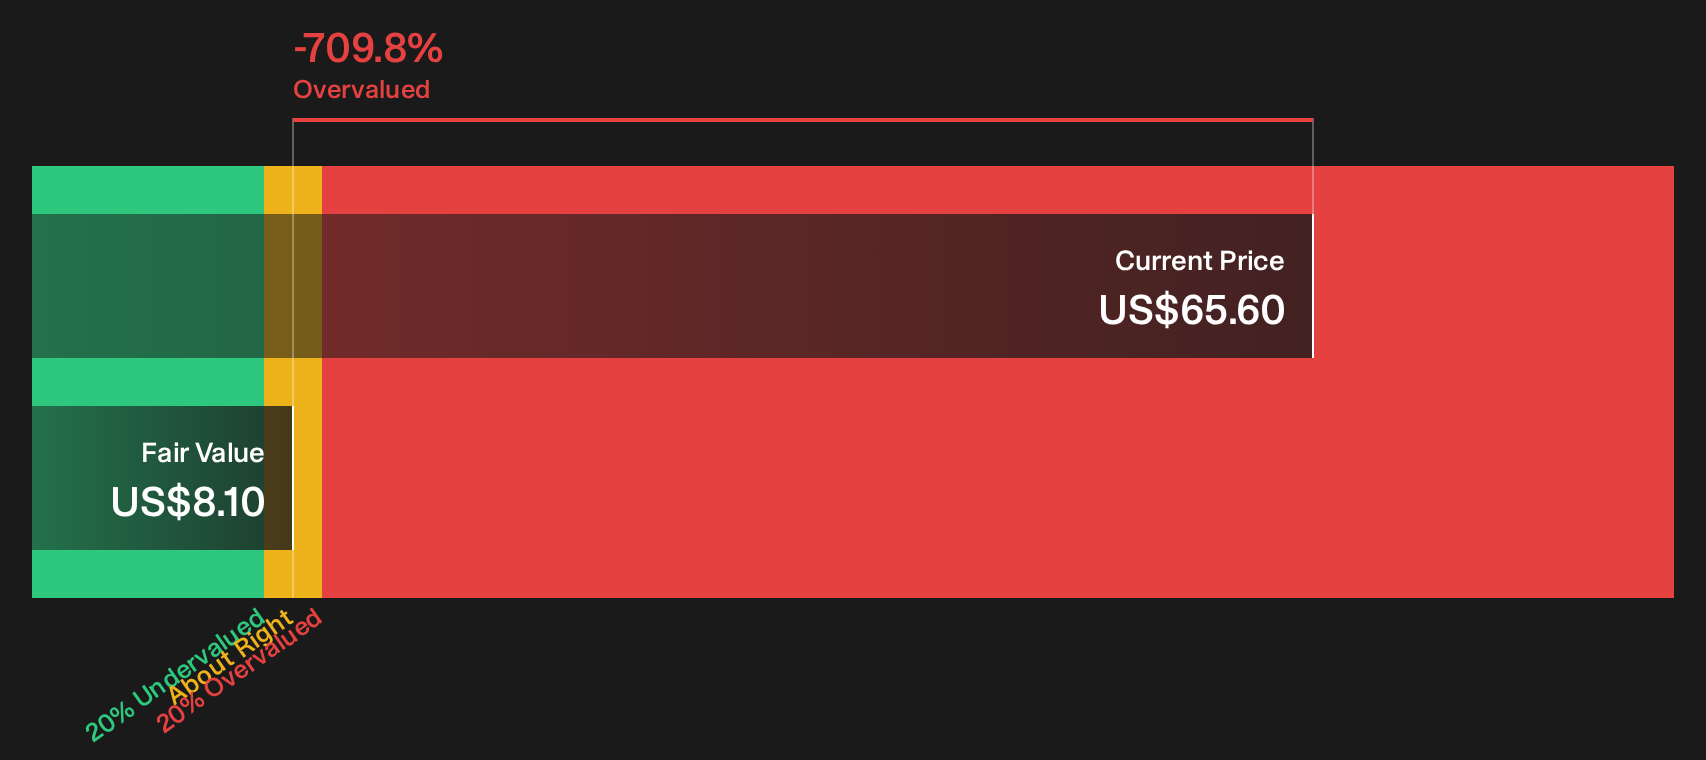
Simply Wall St performs a discounted cash flow (DCF) on every stock in the world every day (check out First American Financial for example). We show the entire calculation in full. You can track the result in your watchlist or portfolio and be alerted when this changes, or use our stock screener to discover 30 high quality undervalued stocks. If you save a screener we even alert you when new companies match - so you never miss a potential opportunity.
Next Steps
If the split views on First American Financial leave you unsure, act quickly, evaluate the assumptions against your own expectations, and then weigh the potential upside using 5 key rewards
Looking for more investment ideas beyond First American Financial?
Do not stop with First American Financial. Put fresh ideas on your radar using screeners that spotlight quality, resilience, and upside potential across different corners of the market.
- Target potential mispricings by scanning a focused list of companies that combine quality fundamentals with appealing valuations using 30 high quality undervalued stocks.
- Prioritise resilience and capital protection by reviewing a curated 30 resilient stocks with low risk scores that highlights businesses with lower overall risk profiles.
- Aim for stronger balance sheet support by checking a list of solid balance sheet and fundamentals (24 results) that filters for financial strength before the crowd pays attention.
This article by Simply Wall St is general in nature. We provide commentary based on historical data and analyst forecasts only using an unbiased methodology and our articles are not intended to be financial advice. It does not constitute a recommendation to buy or sell any stock, and does not take account of your objectives, or your financial situation. We aim to bring you long-term focused analysis driven by fundamental data. Note that our analysis may not factor in the latest price-sensitive company announcements or qualitative material. Simply Wall St has no position in any stocks mentioned.
Have feedback on this article? Concerned about the content? Get in touch with us directly. Alternatively, email editorial-team@simplywallst.com