


Why Nordic American Tankers (NAT) Is Getting Attention Today
Why Nordic American Tankers is Back on Investor Radar
Nordic American Tankers (NAT) is drawing fresh attention after reporting extraordinary market conditions, with spot charter rates well above operating costs and strong cash build from its Suezmax tanker fleet.
Recent trading has reflected that backdrop. The share price is now US$7.66, with a 30-day share price return of 11.01% and a 90-day gain of 30.94%. The year-to-date share price return of 127.30% and 1-year total shareholder return of 176.17% suggest that momentum has been building rather than fading.
Scan for other shipping and energy plays showing similar momentum to Nordic American Tankers with our curated list of 16 high quality undiscovered gems.
Nordic American Tankers has rallied significantly while trading above both its own intrinsic estimate and analyst targets. Is the premium a warning sign, or a fair price for current conditions?
Price-to-Earnings of 13.1x: Is it justified?
On simple earnings maths, Nordic American Tankers looks fully priced, with a P/E of 13.1x against a last close of $7.66 and both its own fair P/E estimate and analyst target signalling a premium rather than a discount.
The P/E ratio links what investors are paying per share to the profits that each share represents. For a tanker operator like Nordic American Tankers, that yardstick often reflects how the market weighs current charter strength against the risk that day rates and income can swing sharply over a cycle.
Here, the market is assigning a higher multiple than the broader US Oil and Gas industry average of 12.6x, and an even steeper premium to the 9.1x level flagged as a fair multiple. That kind of gap suggests investors are willing to pay up for Nordic American Tankers earnings well beyond what both the sector and the regression based fair ratio imply the shares could eventually align with.
Explore the SWS fair ratio for Nordic American Tankers.
Result: Price-to-Earnings of 13.1x (OVERVALUED)
Still, falling annual revenue and net income growth introduce real risk if tanker day rates soften and investors reassess paying a premium for Nordic American Tankers.
Find out about the key risks to this Nordic American Tankers narrative.
Another View on Nordic American Tankers Valuation
The SWS DCF model tells a different story for Nordic American Tankers. At a share price of $7.66 and an estimated future cash flow value of $6.77, the stock screens as expensive on this framework. That gap points to less room for error if tanker conditions cool.
Our DCF output is only as reliable as the long term cash flow assumptions that feed it. Readers need to decide how much faith to place in earnings forecasts and cycle timing. Look into how the SWS DCF model arrives at its fair value.
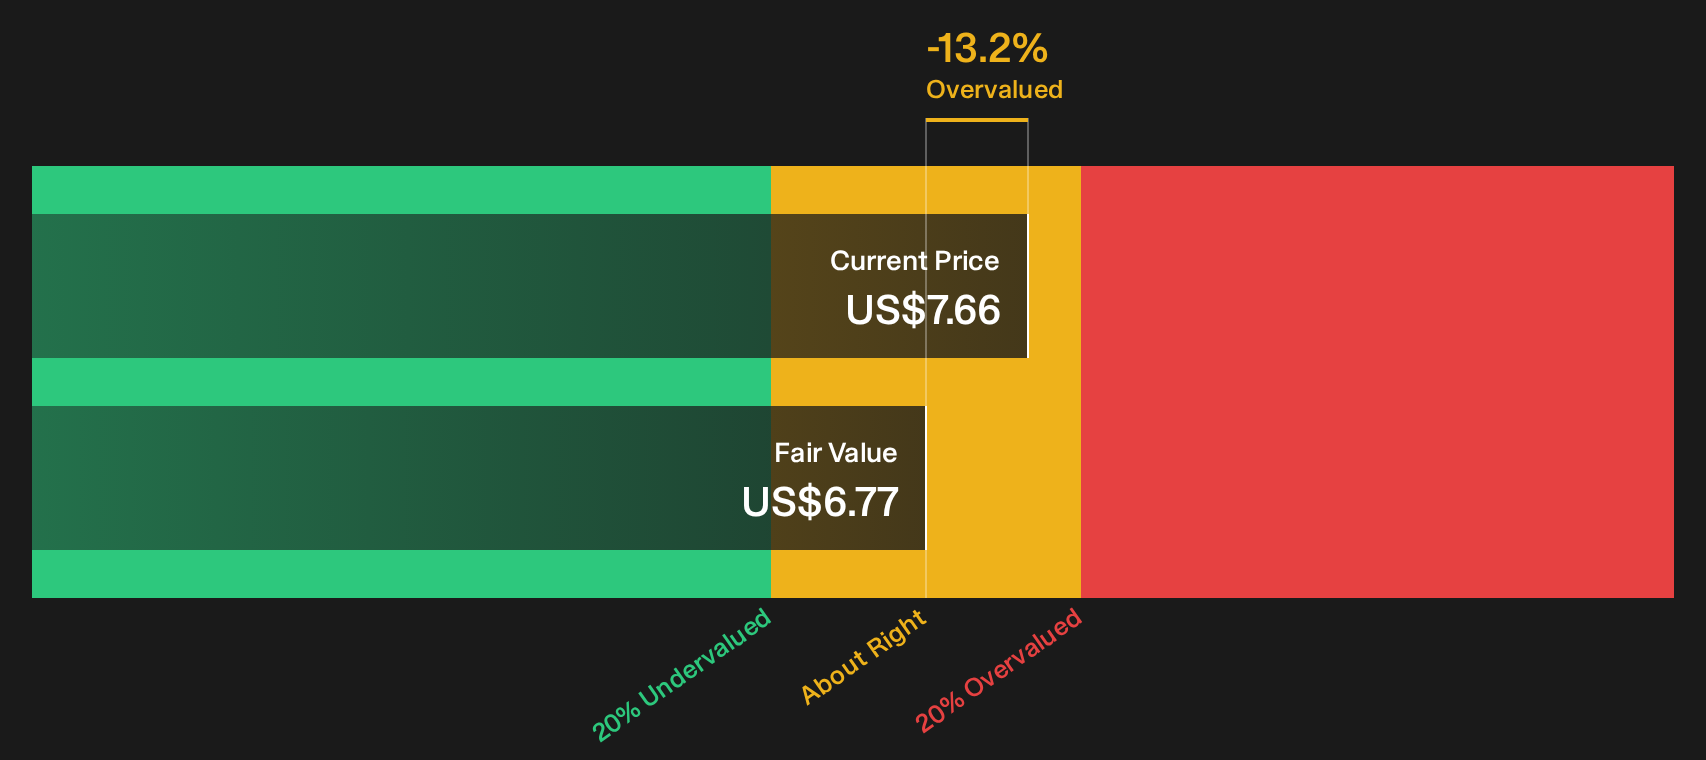
Simply Wall St performs a discounted cash flow (DCF) on every stock in the world every day (check out Nordic American Tankers for example). We show the entire calculation in full. You can track the result in your watchlist or portfolio and be alerted when this changes, or use our stock screener to discover 30 high quality undervalued stocks. If you save a screener we even alert you when new companies match - so you never miss a potential opportunity.
Next Steps
Feeling torn between premium pricing and tanker cycle risk for Nordic American Tankers is reasonable, and this is exactly when fresh data matters most. Take a moment to weigh the upside case against the potential downsides, then ground your own decision in the 2 key rewards and 4 important warning signs.
Looking for more Nordic American Tankers style ideas?
If Nordic American Tankers has sharpened your focus on pricing, risk, and momentum, do not stop at one ticker. Cast the net wider and pressure test your next candidates side by side.
- Spot overlooked potential by running through 16 high quality undiscovered gems that combine quality fundamentals with limited market attention.
- Target resilience first and hunt among 30 resilient stocks with low risk scores that score well on balance sheet strength and business stability.
- Prioritize financial staying power and scan a list of solid balance sheet and fundamentals (23 results) that can better handle industry swings and surprise shocks.
This article by Simply Wall St is general in nature. We provide commentary based on historical data and analyst forecasts only using an unbiased methodology and our articles are not intended to be financial advice. It does not constitute a recommendation to buy or sell any stock, and does not take account of your objectives, or your financial situation. We aim to bring you long-term focused analysis driven by fundamental data. Note that our analysis may not factor in the latest price-sensitive company announcements or qualitative material. Simply Wall St has no position in any stocks mentioned.
Have feedback on this article? Concerned about the content? Get in touch with us directly. Alternatively, email editorial-team@simplywallst.com