


Kasumigaseki CapitalLtd (TSE:3498) As Raised Guidance Puts 17x P E In Focus
Kasumigaseki CapitalLtd (TSE:3498) lifted its earnings guidance for the year to August 31, 2026, after stronger than expected hotel development progress and earlier than planned property sales reshaped its outlook.
The raised guidance lands after a choppy stretch for Kasumigaseki CapitalLtd’s shares, with a 3.06% 1 day share price gain and 9.93% 90 day share price return contrasting with a 1 year total shareholder return that declined 19.33%, while the 5 year total shareholder return is very large at roughly 7x.
Scan how Kasumigaseki CapitalLtd compares with other real estate and asset-heavy plays that screens flag as potential value opportunities in the 17 high quality undervalued stocks.
Kasumigaseki CapitalLtd now trades well below analyst targets even after the guidance lift. Is that discount a cushion for missteps in its hotel projects, or a sign the market sees more risk than the new numbers imply?
Preferred P/E Multiple of 17x for Kasumigaseki CapitalLtd: Is it justified?
On simple earnings terms, Kasumigaseki CapitalLtd trades on a P/E of 17x, which screens as expensive compared with both its real estate peers and the wider Japan market despite the recent share price pullback and upgraded guidance.
The P/E ratio compares the current share price to earnings per share. For a real estate consulting and asset-heavy developer like Kasumigaseki CapitalLtd, it gives a quick read on how much investors are currently paying for each unit of profit generated from hotels, logistics facilities, solar assets and related projects.
Here, the stock is described as expensive versus the JP Real Estate industry average P/E of 10x and a peer average of 14.4x. That suggests the market is paying a premium for Kasumigaseki CapitalLtd's earnings, even though its current Return on Equity of 14.3% is flagged as low, while earnings quality is assessed as high and profit growth has been strong. At the same time, the estimated fair P/E of 23.3x is materially higher than the current 17x. This indicates scope for the valuation multiple to move closer to that fair level if the forecast earnings growth and margins are delivered consistently.
The contrast is sharp. Kasumigaseki CapitalLtd is framed as expensive when lined up against the sector and peer averages, yet good value when compared with its own fair P/E estimate of 23.3x. This is the level the SWS fair ratio suggests the multiple could gravitate toward if conditions support it. Result: Price-to-Earnings of 17x (ABOUT RIGHT).
Explore the SWS fair ratio for Kasumigaseki CapitalLtd.
Still, that fair P/E narrative can unravel quickly if hotel projects fall behind the new timetable or if asset sales in Japan are completed at weaker than expected prices.
Find out about the key risks to this Kasumigaseki CapitalLtd narrative.
Another View on Kasumigaseki CapitalLtd’s Valuation
That fair P/E story leads to a very different conclusion once the SWS DCF model is brought in. On this cash flow based view, Kasumigaseki CapitalLtd at ¥7,420 trades well above an estimated future cash flow value of ¥1,026.45, which frames the shares as overvalued rather than mildly cheap.
For anyone weighing which signal to trust, it helps to see how the SWS DCF model is built and what assumptions sit underneath that large gap between price and cash flow value. Look into how the SWS DCF model arrives at its fair value.
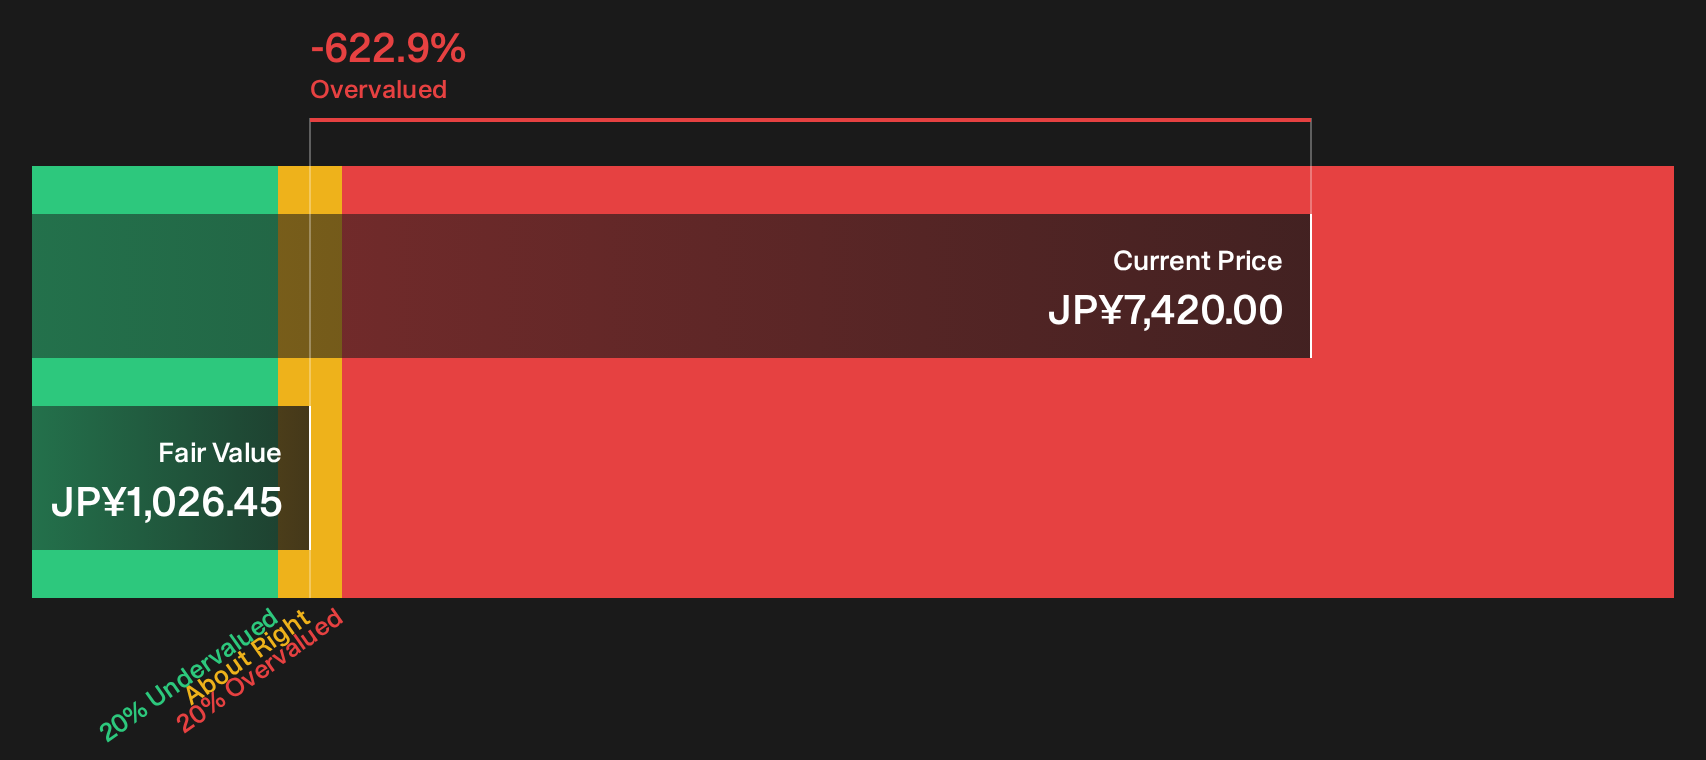
Simply Wall St performs a discounted cash flow (DCF) on every stock in the world every day (check out Kasumigaseki CapitalLtd for example). We show the entire calculation in full. You can track the result in your watchlist or portfolio and be alerted when this changes, or use our stock screener to discover 17 high quality undervalued stocks. If you save a screener we even alert you when new companies match - so you never miss a potential opportunity.
Next Steps
Mixed signals around Kasumigaseki CapitalLtd’s value and risk profile make this a judgment call rather than an obvious verdict. Move quickly, review the underlying data, then weigh both the 3 key rewards and 2 important warning signs.
Looking for more investment ideas beyond Kasumigaseki CapitalLtd?
If Kasumigaseki CapitalLtd has your attention, do not stop here. Use the Simply Wall Street Screener to surface fresh ideas that fit your own risk and return preferences.
- Target resilient cash generators by reviewing companies in the list of solid balance sheet and fundamentals (21 results) that aim to pair healthy finances with fundamental strength.
- Hunt for mispriced opportunities by scanning the 17 high quality undervalued stocks that focuses on quality businesses trading below estimated worth.
- Spot under-the-radar potential by checking the 75 high quality undiscovered gems and see which quieter stories have numbers that may warrant a closer look.
This article by Simply Wall St is general in nature. We provide commentary based on historical data and analyst forecasts only using an unbiased methodology and our articles are not intended to be financial advice. It does not constitute a recommendation to buy or sell any stock, and does not take account of your objectives, or your financial situation. We aim to bring you long-term focused analysis driven by fundamental data. Note that our analysis may not factor in the latest price-sensitive company announcements or qualitative material. Simply Wall St has no position in any stocks mentioned.
Have feedback on this article? Concerned about the content? Get in touch with us directly. Alternatively, email editorial-team@simplywallst.com