


How Investors May Respond To Compass Pathways Stock 52 Week Depression Trial Results
- Compass Pathways released 52 week topline data from its Phase 3 COMP005 trial of COMP360 in treatment resistant depression, reporting sustained MADRS score reductions, 40% to 45% responder rates, about 30% remission rates, and a safety profile consistent with earlier trial parts.
- The ability to show year long symptom relief with limited dosing, including first time 25 mg exposure in former placebo patients, directly addresses treatment durability and resource use in COMPASS Pathways' core depression program.
- We will now look at how COMPASS Pathways' investment narrative is shaped by year long COMP360 durability and safety signals.
COMPASS Pathways Investment Narrative Recap
To own COMPASS Pathways, you need to believe that COMP360 can move from a late stage trial asset to an approved, reimbursed treatment in treatment resistant depression and then into other conditions. The new 52 week COMP005 data speaks directly to durability and safety, which sit at the center of that belief. In the near term, the main catalyst remains completion of COMP006 and a potential rolling NDA.
The biggest operational risk is still binary. Trial setbacks, regulatory delays or extra data requests could collide with cash usage that already runs at an expected US$120 million to US$145 million in 2025. That combination could force fresh financing or tighter spending just as commercial build out is ramping.
Among the recent developments, the plan to use COMP006 Part A data alongside earlier COMP005 readouts for a rolling NDA is the most relevant touchpoint. The fresh 52 week COMP005 outcomes give management more long horizon evidence as they assemble that package. For investors, the story becomes about whether regulators view these datasets as complementary.
Operationally, success hinges on three execution steps that all tie back to these announcements. First, finishing COMP006 to a standard that matches or reinforces the COMP005 profile. Second, maintaining active FDA engagement so rolling submission timelines stay realistic. Third, scaling interventional psychiatry partnerships without letting commercial spending run too far ahead of any eventual approval.
COMPASS Pathways' narrative projects US$284.9 million revenue and US$53.9 million earnings by 2029. This implies a move from no revenue today and an earnings increase of about US$246.3 million from current earnings of a US$192.4 million loss.
Uncover how COMPASS Pathways' fair value indicates a 66% potential upside to its current price, which could narrow quickly as more investors digest the COMP005 readout.
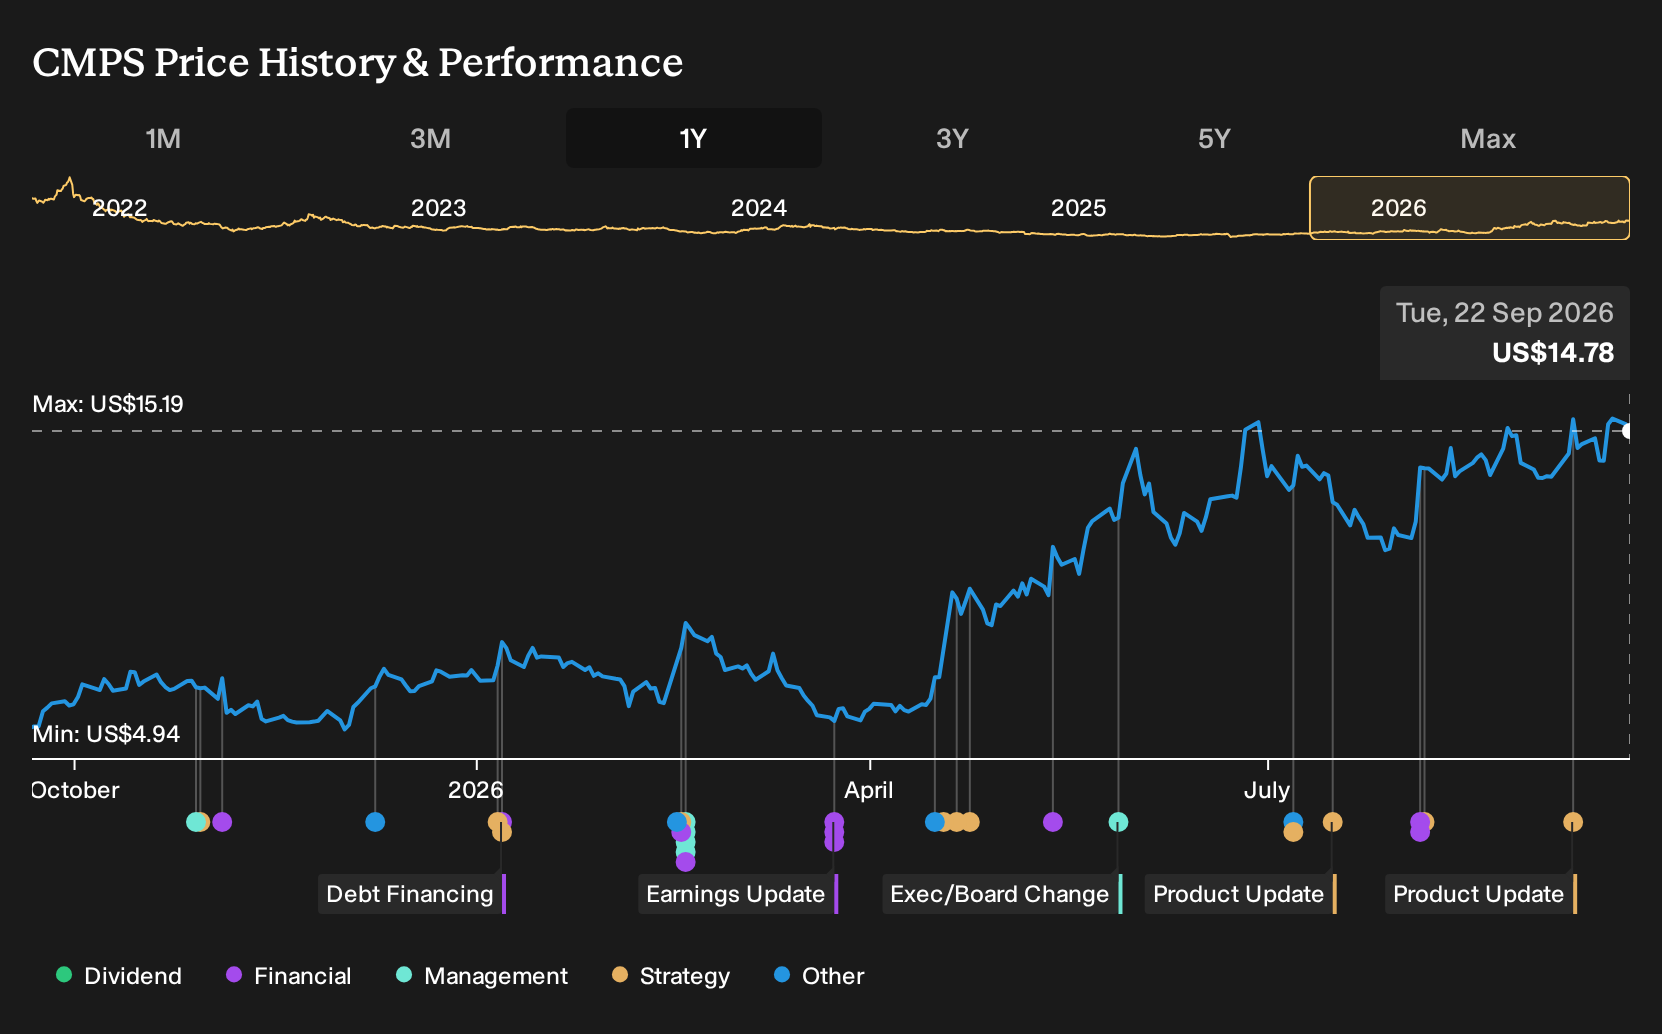
Exploring Other Perspectives
One alternate view on COMPASS Pathways leans into the potential upside of faster regulatory timing. The most optimistic analysts were already modeling US$667.4 million in revenue and US$29.6 million in earnings by 2029, with a very high implied P/E multiple. You can treat the fresh 52 week data as a reason to revisit those assumptions and compare different scenarios.
Explore 3 other COMPASS Pathways fair value estimates, including one that suggests as much as 600% upside from the current price.
Reach Your Own Conclusion
Disagree with existing narratives? Extraordinary investment returns rarely come from following the herd, so go with your instincts.
- A great starting point for your COMPASS Pathways research is our analysis highlighting 2 key rewards and 3 important warning signs that could impact your investment decision.
- See our latest analysis for COMPASS Pathways. The report includes a comprehensive fundamental analysis summarized in a single visual, the Snowflake, which makes it easy to evaluate COMPASS Pathways' overall financial health at a glance.
Looking For More Investment Ideas Beyond COMPASS Pathways?
If the COMPASS Pathways story has sharpened your thinking around risk, timelines, and upside, it can help to compare it with other opportunities that fit very different profiles. The Simply Wall St Screener lets you line up alternatives side by side so you can decide where COMPASS Pathways belongs in your broader portfolio.
- If capital preservation comes first for you, start with a group of companies that screen for balance sheet strength and resilient fundamentals through our list of solid balance sheet and fundamentals (23 results).
- If you are hunting for potential mispricing rather than headlines, check out a curated pool of businesses that flag as quality yet potentially underappreciated using the 29 high quality undervalued stocks.
- If you prefer to search for earlier stage opportunities with room to grow, scan a focused set of smaller stocks that combine stronger fundamentals with limited market attention via the 16 high quality undiscovered gems.
This article by Simply Wall St is general in nature. We provide commentary based on historical data and analyst forecasts only using an unbiased methodology and our articles are not intended to be financial advice. It does not constitute a recommendation to buy or sell any stock, and does not take account of your objectives, or your financial situation. We aim to bring you long-term focused analysis driven by fundamental data. Note that our analysis may not factor in the latest price-sensitive company announcements or qualitative material. Simply Wall St has no position in any stocks mentioned.
Have feedback on this article? Concerned about the content? Get in touch with us directly. Alternatively, email editorial-team@simplywallst.com