


Figma (FIG) Could Be 3% Undervalued Following Its Recent Pullback
Figma (FIG) has come under pressure recently, with the share price closing at US$21.80 and posting declines over the past day, week and month despite reported revenue and net income growth.
For context, the recent slide extends a tougher year for Figma, with the share price down 42.0% year to date and the 1-year total shareholder return falling 62.5%. However, the 90-day share price return is still up 17.0%, which hints that earlier momentum is fading as investors reassess both growth prospects and risk around the business.
Scan beyond Figma's pullback and explore other software-focused opportunities using our hand picked list of 16 high quality undiscovered gems.
Bulls point to Figma’s reported revenue and net income growth. Bears focus on the share price slide and ongoing losses. Which story does the current valuation actually support next?
Most Popular Narrative: 2.5% Undervalued
The most followed narrative on Figma pegs fair value at $22.36, slightly above the latest close at $21.80. This frames the current pullback as more about timing and expectations rather than a broken business model.
A great product can still be an expensive stock. For now, I’m more confident in Figma’s competitive position, but I would want clearer operating leverage before becoming materially more optimistic about the valuation.
See why 63 investors see Figma as 3% undervalued.
Result: Fair Value of $22.36 (ABOUT RIGHT)
Still, Figma’s reported net income loss of US$1.53b and weaker free cash flow margin in the latest narrative update could pressure confidence in that slight undervaluation story.
Find out about the key risks to this Figma narrative.
Another View on Figma’s Valuation
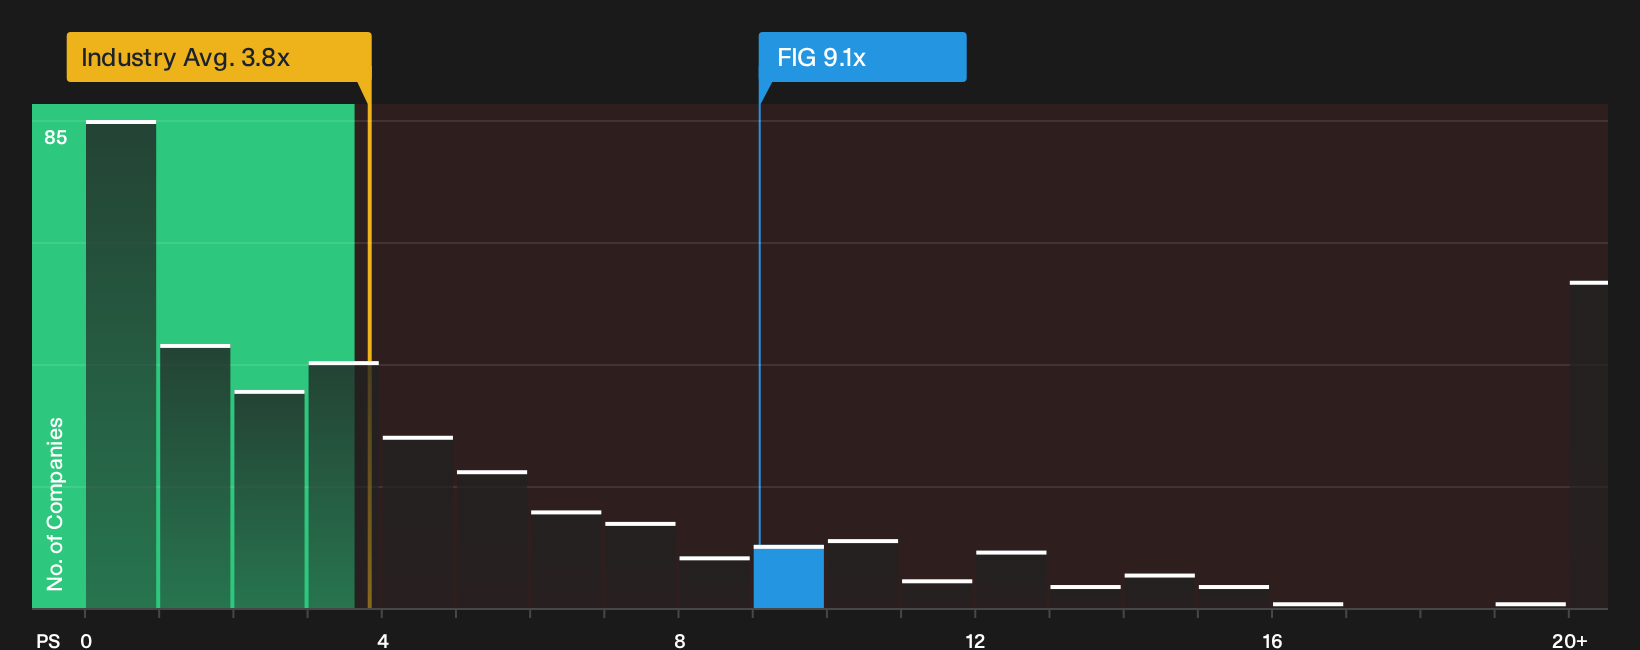
There is a different read on Figma when you focus on the current sales multiple. The stock trades at a P/S of 9.1x, which is much richer than the US Software industry at 3.8x and also above a fair ratio estimate of 8.9x. That gap points to less of a clear bargain and more of a pricing risk if expectations slip again.
Investors who lean on relative pricing often want to stress test that premium against detailed modelling. This is where our valuation breakdown can help make sense of the trade off between growth and price today, See what the numbers say about this price — find out in our valuation breakdown..
Next Steps
Mixed messages around Figma can feel confusing. Take a moment to inspect the drivers, weigh both sides, and judge the risk reward balance yourself with 3 key rewards and 3 important warning signs.
Looking for more Figma investment ideas?
If Figma has sharpened your view on risk and reward, do not stop here. Fresh ideas often come from comparing very different types of opportunities side by side.
- Target companies that combine quality and attractive pricing by scanning a focused set of 29 high quality undervalued stocks that may merit a closer look.
- Strengthen resilience in your portfolio by reviewing a list of solid balance sheet and fundamentals (23 results) that can better withstand tougher conditions.
- Boost your income focus by assessing a curated group of 7 dividend fortresses that prioritise robust payouts.
This article by Simply Wall St is general in nature. We provide commentary based on historical data and analyst forecasts only using an unbiased methodology and our articles are not intended to be financial advice. It does not constitute a recommendation to buy or sell any stock, and does not take account of your objectives, or your financial situation. We aim to bring you long-term focused analysis driven by fundamental data. Note that our analysis may not factor in the latest price-sensitive company announcements or qualitative material. Simply Wall St has no position in any stocks mentioned.
Have feedback on this article? Concerned about the content? Get in touch with us directly. Alternatively, email editorial-team@simplywallst.com