


Versamet Royalties (TSX:VMET) Joins A Major Mining Index, Is It A Bargain Or Fully Priced?
Versamet Royalties (TSX:VMET) was added to the S&P/TSX Global Mining Index on 11 September 2026, putting the metals royalty company on the radar of more benchmark-driven institutional investors.
Versamet Royalties has attracted fresh attention after the index addition, and the share price now sits at CA$13.81 following a 1-day share price return of 4.70% and a 7-day share price return of 4.78%. However, the 30-day and 90-day share price returns declined 5.35% and 13.53% respectively, while the 1-year total shareholder return of 49.30% points to strong longer term momentum building behind the stock.
Scan the metals royalty space around Versamet Royalties by checking a curated list of peers and potential alternatives in the 35 best rare earth metal stocks.
Versamet Royalties has just climbed into a major index and the share price has moved, yet analyst targets and intrinsic value models still point to a wide gap. Where does a reasonable fair value range land now?
Price-to-Earnings of 28.9x: Is it justified?
Versamet Royalties closed at CA$13.81 while trading on a P/E of 28.9x, which is higher than both the Canadian metals and mining industry and its closest peers. That premium raises a clear question for anyone watching the stock closely: Is the market paying up too much for expected cash flows and future deals, or are analysts and intrinsic value models flagging something the current quote has not fully reflected yet?
The P/E ratio compares what investors are willing to pay today for each dollar of current earnings. For a metals royalty business like Versamet Royalties, that earnings multiple often embeds expectations around future streaming deals, the ramp up of underlying mines, and how reliably cash flows convert from a mix of different projects. A higher ratio implies investors are comfortable valuing those current profits more richly than the sector average.
VMET is described as expensive on this P/E measure compared with the Canadian metals and mining group at 16.5x and also relative to its peer set at 25.1x. The market is therefore assigning a meaningfully richer tag to Versamet Royalties than to the broader industry. At the same time, the SWS DCF model estimates a future cash flow value of CA$48.36 per share, which sits well above the current CA$13.81 trading level, indicating that cash flow based valuation work does not line up neatly with the earnings multiple signal.
See what the numbers say about this price — find out in our valuation breakdown.
Result: Price-to-Earnings of 28.9x (OVERVALUED)
Still, Versamet Royalties relies on a concentrated set of royalty sources, and any delay, dispute, or operational issue at those projects could challenge the current valuation story.
Find out about the key risks to this Versamet Royalties narrative.
Another View on Versamet Royalties: Cash Flow Says Undervalued
The P/E screen flags Versamet Royalties as expensive, yet the SWS DCF model points the other way. That approach estimates a future cash flow value of CA$48.36 per share versus the current CA$13.81, which implies a deep discount. If earnings look pricey but cash flows look cheap, which signal carries more weight for you?
Look into how the SWS DCF model arrives at its fair value.
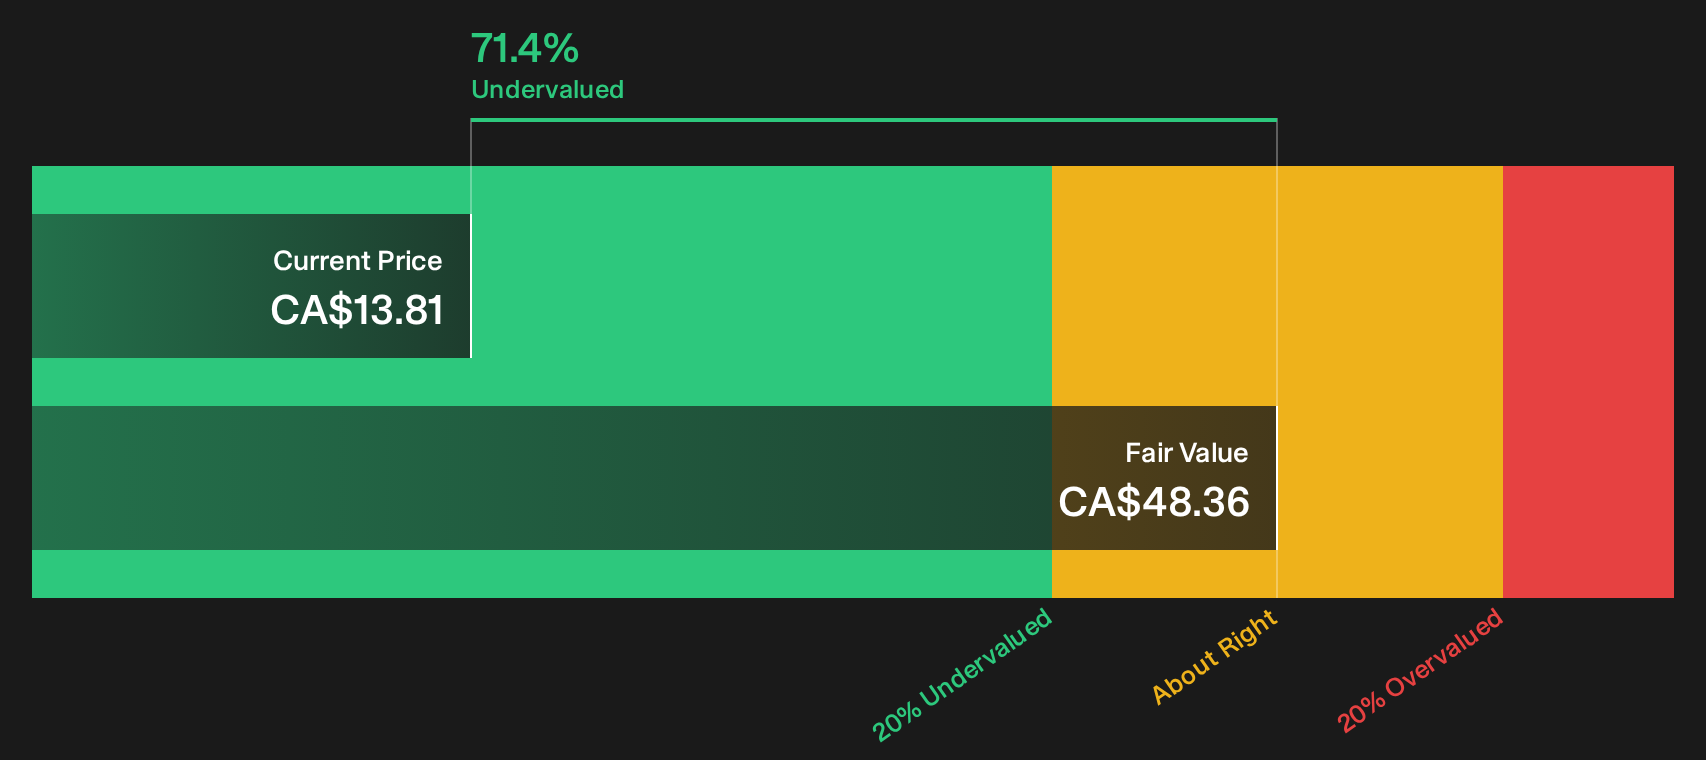
Simply Wall St performs a discounted cash flow (DCF) on every stock in the world every day (check out Versamet Royalties for example). We show the entire calculation in full. You can track the result in your watchlist or portfolio and be alerted when this changes, or use our stock screener to discover 7 high quality undervalued stocks. If you save a screener we even alert you when new companies match - so you never miss a potential opportunity.
Next Steps
Mixed signals on Versamet Royalties so far. If you want to move fast and judge the trade off between concerns and potential upside yourself, start with the 4 key rewards and 3 important warning signs.
Looking for more investment ideas beyond Versamet Royalties?
If Versamet Royalties has your attention, do not stop at a single stock. Let a broader watchlist of ideas sharpen your next move and highlight opportunities you might otherwise miss.
- Target potential mispricings by scanning a focused set of companies that screen as high quality yet trading at a discount through the 7 high quality undervalued stocks.
- Strengthen portfolio resilience by reviewing a list of solid balance sheet and fundamentals (7 results) that can help you stress test your holdings against weaker capital structures.
- Get ahead of the crowd by checking a curated pool of 9 high quality undiscovered gems before they appear on more investors' radars.
This article by Simply Wall St is general in nature. We provide commentary based on historical data and analyst forecasts only using an unbiased methodology and our articles are not intended to be financial advice. It does not constitute a recommendation to buy or sell any stock, and does not take account of your objectives, or your financial situation. We aim to bring you long-term focused analysis driven by fundamental data. Note that our analysis may not factor in the latest price-sensitive company announcements or qualitative material. Simply Wall St has no position in any stocks mentioned.
Have feedback on this article? Concerned about the content? Get in touch with us directly. Alternatively, email editorial-team@simplywallst.com