


NFI Group (TSX:NFI) Lands Houston Bus Order As Backlog Narrative Shapes Valuation
NFI Group (TSX:NFI) drew fresh attention after subsidiary New Flyer of America secured a roughly $93 million order from Houston METRO for 100 compressed natural gas buses, backed by US federal transit funding.
That Houston METRO contract lands at a time when NFI Group’s momentum has already picked up, with a year to date share price return of 47.52% and a three year total shareholder return of 92.31% pointing to investors reassessing both growth prospects and risk.
Scan for other transit and infrastructure players that are moving on contract wins and cleaner fleets with our curated 40 power grid technology and infrastructure stocks
NFI Group now has a fuller order book, a sharp share price move and improving earnings. The real question is whether that mix is already fully reflected in today’s CA$23.75 price.
Most Popular Narrative: 25% Undervalued
The prevailing narrative pegs NFI Group’s fair value at CA$31.54, which sits well above the last close at CA$23.75, putting fresh focus on how much of the turnaround story is already priced in.
Record multiyear backlog (over $13.5 billion, with high option conversion rates and strong book-to-bill ratios) provides significant forward visibility and positions NFI to benefit from the ongoing replacement cycle of aging bus fleets in North America and Europe, directly supporting future revenue growth.
See why 24 investors see NFI Group as 25% undervalued.
NFI Group’s most followed storyline builds a valuation using an 8.83% discount rate and a fair value estimate of CA$31.54, compared with the current CA$23.75 share price. That framework leans heavily on expectations for earnings to rise from $54.0 million today to $296.1 million by around 2029, alongside a move in profit margin from 1.4% to 6.2% and a future P/E of 11.8x on those projected earnings.
Under this view, investors are being asked to accept slower forecast revenue expansion of 7.9% a year and a margin profile that remains below earlier models, offset by what analysts describe as a cleaner balance between manufacturing and higher margin aftermarket activity. The same narrative flags risks around high leverage, tariff uncertainty and pressure in the U.K. operation, so the 24.7% discount to the CA$31.54 fair value is not framed as a free lunch but as compensation for execution and policy risk that could affect NFI Group over the next several years.
Result: Fair Value of CA$31.54 (UNDERVALUED)
Still, the NFI Group story can change quickly if high leverage limits flexibility or if U.K. weakness and tariff costs hit margins harder than expected.
Find out about the key risks to this NFI Group narrative.
Another View: NFI Group Through The Earnings Multiple Lens
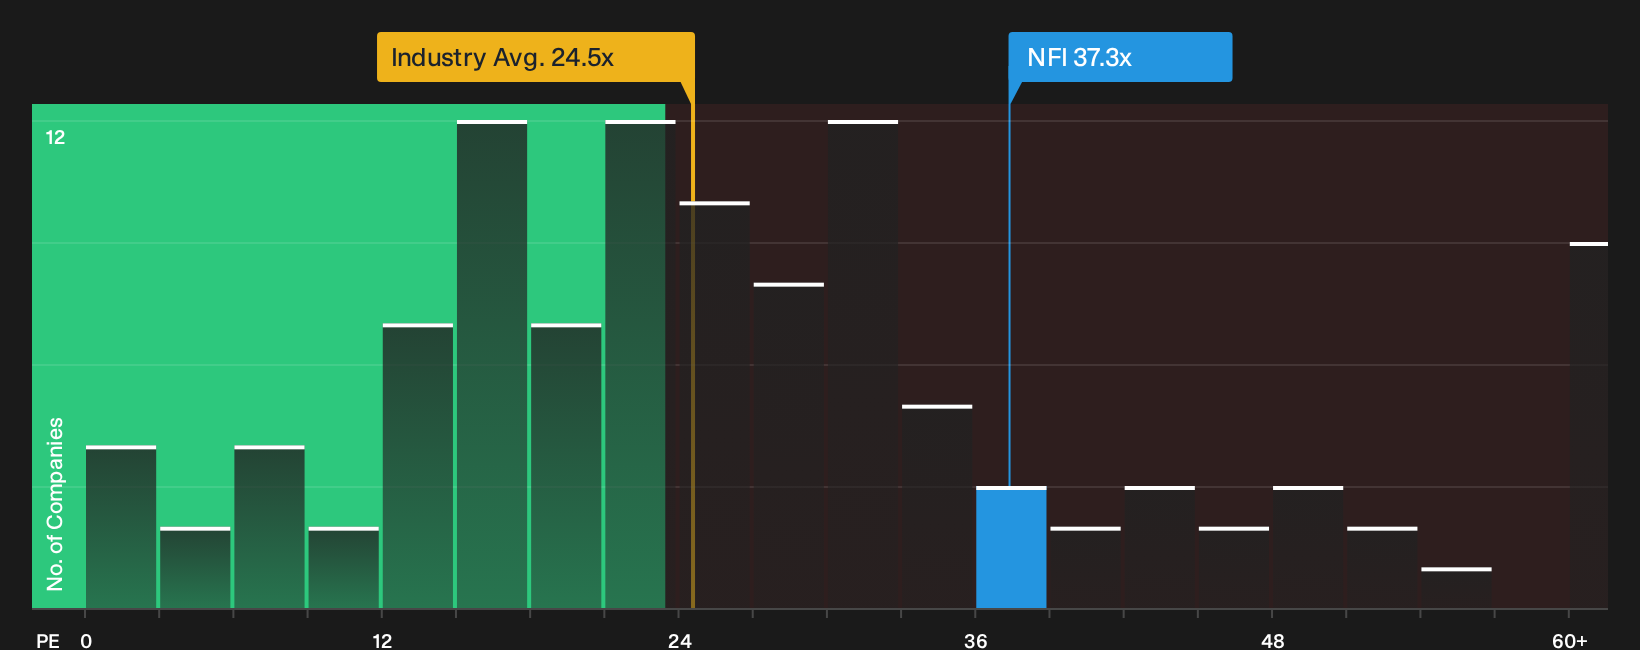
There is a very different story when NFI Group is viewed through its current P/E ratio of 37.3x. That level sits above the wider North American Machinery industry at 24.4x, yet below the peer group average at 40.8x and the fair ratio of 53.7x that our model suggests the market could move toward.
For investors, that gap means the stock already builds in meaningful expectations, but not as much as peers or the fair ratio imply. This raises a simple question: Is this pricing a cushion for risk or a signal that enthusiasm has already run ahead of the turnaround story?
To pressure test that view against the underlying numbers and see how the current ratio stacks up, take a look at the See what the numbers say about this price — find out in our valuation breakdown..
Here is how NFI Group's current valuation compares visually with its sector using the P/E measure, which can help you judge how stretched or conservative the market's expectations really are relative to peers and the fair ratio reference point.
Next Steps
Mixed sentiment runs through the NFI Group story, so move quickly, pull up the full dataset and weigh both the 4 key rewards and 2 important warning signs.
Looking for more NFI Group style opportunities?
If you want to keep building on the work you have already done on NFI Group, use the Simply Wall Street Screener to surface fresh ideas before others.
- Target potential mispricings by scanning a curated list of companies trading below their assessed value with strong fundamentals through our 6 high quality undervalued stocks.
- Lock in potential income streams by sorting for resilient businesses that pay substantial yields using the focused 1 dividend fortresses.
- Reduce portfolio shocks by filtering for companies with robust finances and low risk indicators through the disciplined 8 resilient stocks with low risk scores.
This article by Simply Wall St is general in nature. We provide commentary based on historical data and analyst forecasts only using an unbiased methodology and our articles are not intended to be financial advice. It does not constitute a recommendation to buy or sell any stock, and does not take account of your objectives, or your financial situation. We aim to bring you long-term focused analysis driven by fundamental data. Note that our analysis may not factor in the latest price-sensitive company announcements or qualitative material. Simply Wall St has no position in any stocks mentioned.
Have feedback on this article? Concerned about the content? Get in touch with us directly. Alternatively, email editorial-team@simplywallst.com