


RBC Bearings (RBC) Board Change And Conference Run Keep Valuation Questions Alive
Board change and upcoming conferences put RBC Bearings in focus
RBC Bearings (RBC) has drawn fresh attention after long-serving director Frederick J. Elmy retired from the board on September 3, 2026, alongside a cluster of high-profile conference appearances.
Recent share price action has been mixed, with the stock down 22.24% over 90 days but still up 7.36% year to date at US$492.56. Meanwhile, RBC Bearings’ 1 year total shareholder return of 28.44% and 3 year total shareholder return of 108.09% point to momentum built over a longer horizon.
Scan beyond RBC Bearings and see how other industrial and aerospace players are setting up for potential breakouts with our hand picked 95 robotics and automation stocks
RBC Bearings appears to be a high quality industrial and aerospace supplier based on recent revenue and net income data, yet the share price pullback complicates the story. Do the current fundamentals still justify a US$492.56 tag?
Price-to-earnings of 48.5x for RBC Bearings: Is it justified?
RBC Bearings trades on a P/E of 48.5x, which looks rich next to both its peers and the wider US Machinery industry given the recent $492.56 share price.
The P/E ratio compares the current share price to earnings per share and, for a business like RBC Bearings, it signals how much investors are willing to pay for each dollar of profit. High multiples often suggest the market is baking in strong profit expansion or a premium quality profile, while lower readings can indicate more modest expectations or perceived risk.
Here, the stock changes hands at 48.5x earnings against a peer average of 30.6x and a US Machinery industry level of 24.4x. That is a materially higher bar. The fair P/E estimate of 27.1x also sits well below the current ratio, which points to a valuation level the market could move toward if expectations cool.
Explore the SWS fair ratio for RBC Bearings.
Result: Price-to-earnings of 48.5x (OVERVALUED)
Still, the premium P/E can quickly look fragile if aerospace or industrial demand softens, or if RBC Bearings stumbles on execution after its board reshuffle.
Find out about the key risks to this RBC Bearings narrative.
Another view on RBC Bearings using our DCF model
The first check painted RBC Bearings as expensive on a P/E of 48.5x. A second lens tells a similar story. Our DCF model points to a future cash flow value of about US$353.34 per share, well below the current US$492.56 level. Is the market paying up for quality, or is it simply overpaying?
Look into how the SWS DCF model arrives at its fair value.
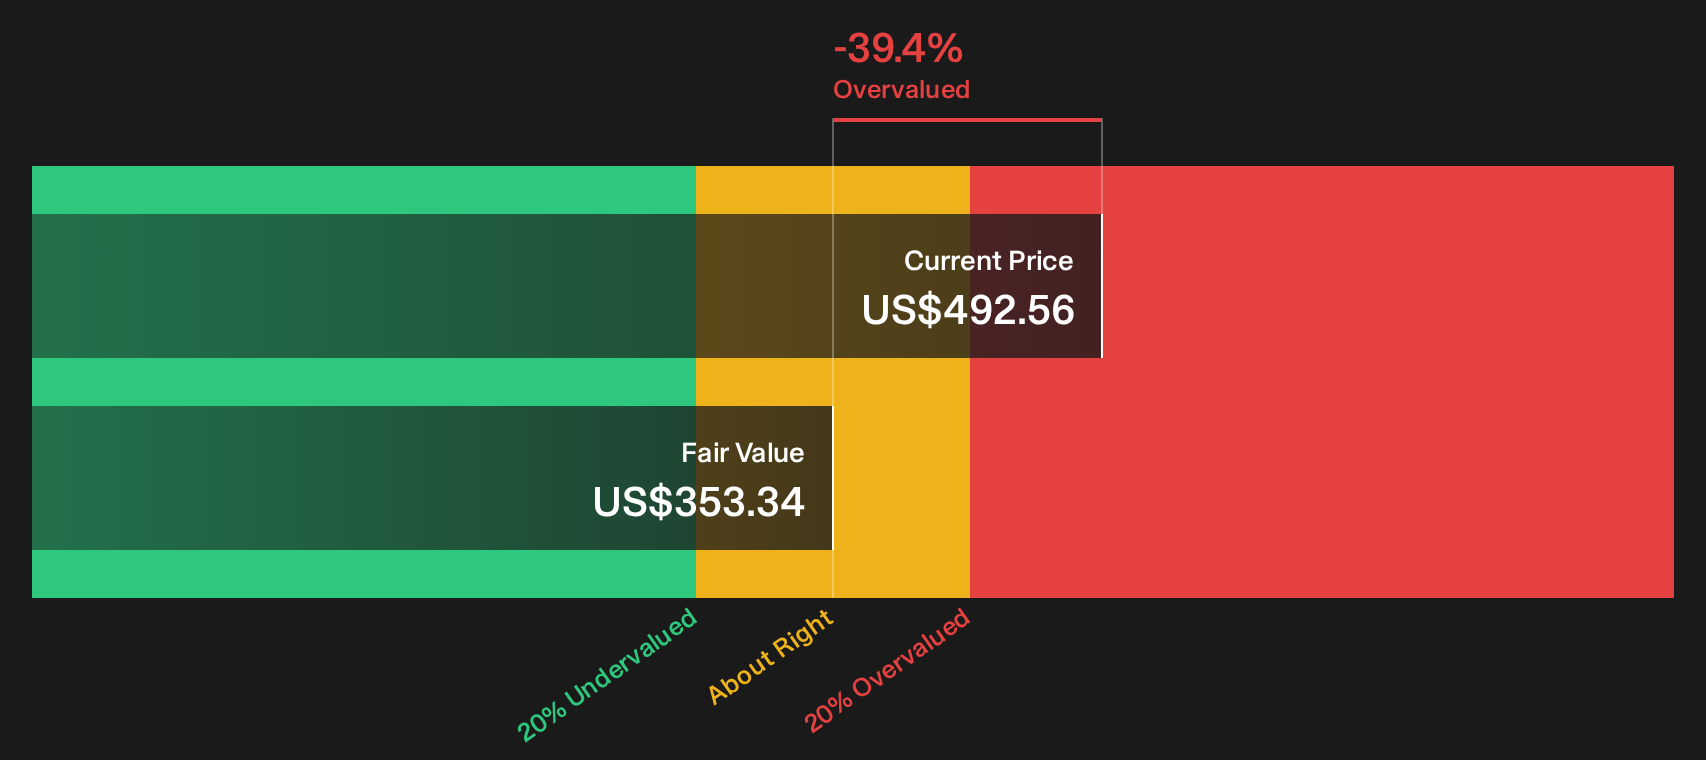
Simply Wall St performs a discounted cash flow (DCF) on every stock in the world every day (check out RBC Bearings for example). We show the entire calculation in full. You can track the result in your watchlist or portfolio and be alerted when this changes, or use our stock screener to discover 30 high quality undervalued stocks. If you save a screener we even alert you when new companies match - so you never miss a potential opportunity.
Next Steps
If you are unconvinced by the tone of this RBC Bearings review so far, or leaning the other way on the valuation debate, consider quickly reviewing the underlying data and context before the story changes again. To round out your own work, make sure you weigh the 3 key rewards
Looking for more RBC Bearings investment ideas?
Before moving on, take a moment to scan a few focused stock lists built from the same data engine that underpins this RBC Bearings review.
- Target stability first and see 30 resilient stocks with low risk scores that line up with resilient balance sheets and measured risk profiles.
- Hunt for value opportunities and use the 30 high quality undervalued stocks to spot companies where quality and pricing look out of sync.
- Aim for strength beneath the surface by reviewing the list of solid balance sheet and fundamentals (23 results) and focus on businesses with fundamentals that can support future decisions.
This article by Simply Wall St is general in nature. We provide commentary based on historical data and analyst forecasts only using an unbiased methodology and our articles are not intended to be financial advice. It does not constitute a recommendation to buy or sell any stock, and does not take account of your objectives, or your financial situation. We aim to bring you long-term focused analysis driven by fundamental data. Note that our analysis may not factor in the latest price-sensitive company announcements or qualitative material. Simply Wall St has no position in any stocks mentioned.
Have feedback on this article? Concerned about the content? Get in touch with us directly. Alternatively, email editorial-team@simplywallst.com