


Kenon Holdings (TASE:KEN) Earnings Growth Keeps The Valuation Debate Alive
Kenon Holdings (TASE:KEN) just released its second quarter and first half 2026 results, showing higher sales and net income versus a year ago. These figures are now central to how you might assess the stock.
Kenon Holdings’ latest report has arrived after a strong run for long‑term holders, with a 1‑year total shareholder return of 51.25% and a 3‑year total shareholder return above 2x. However, the share price return year to date is down 7.26%, and short term price moves around ₪200.6 suggest momentum has cooled after earlier gains.
Compare Kenon Holdings’ latest earnings momentum with other power and infrastructure players by scanning our hand picked 40 power grid technology and infrastructure stocks aligned with this theme.
Recent earnings have refreshed the story for Kenon Holdings, yet the share price has already rewarded patient holders. The key tension now is simple: Is most of the upside already in the rear view mirror, or not?
Preferred P/E of 28.9x for Kenon Holdings: Is it justified?
On traditional valuation metrics, Kenon Holdings screens as cheaper than some peers but richer than others. The stock closed at ₪200.6, and on a P/E of 28.9x it screens as good value versus its direct peer set, yet it trades on a higher earnings multiple than the broader Asian renewable energy group.
The P/E ratio compares the current share price with earnings per share. For a power generation and energy operator like Kenon Holdings, this measure often reflects how the market weighs the stability of contracted cash flows against earnings volatility. A higher P/E can indicate investors are willing to pay more for each unit of profit because they see those profits as higher quality or more dependable.
Kenon Holdings is flagged as good value when lined up against its peer average P/E of 83.9x, which is a wide gap. At the same time, the P/E of 28.9x is considered expensive relative to the Asian renewable energy industry average of 14.6x. That split picture suggests the market is putting a richer tag on Kenon Holdings than on the broader sector, while still assigning a far lower multiple than some direct comparables. Investors therefore need to decide which reference group they think matters more.
See what the numbers say about this price — find out in our valuation breakdown.
Result: Price-to-earnings of 28.9x (ABOUT RIGHT)
Still, the story around Kenon Holdings could shift quickly if power demand weakens in key markets, or if project development faces delays or higher costs.
Find out about the key risks to this Kenon Holdings narrative.
Another view on Kenon Holdings using cash flows
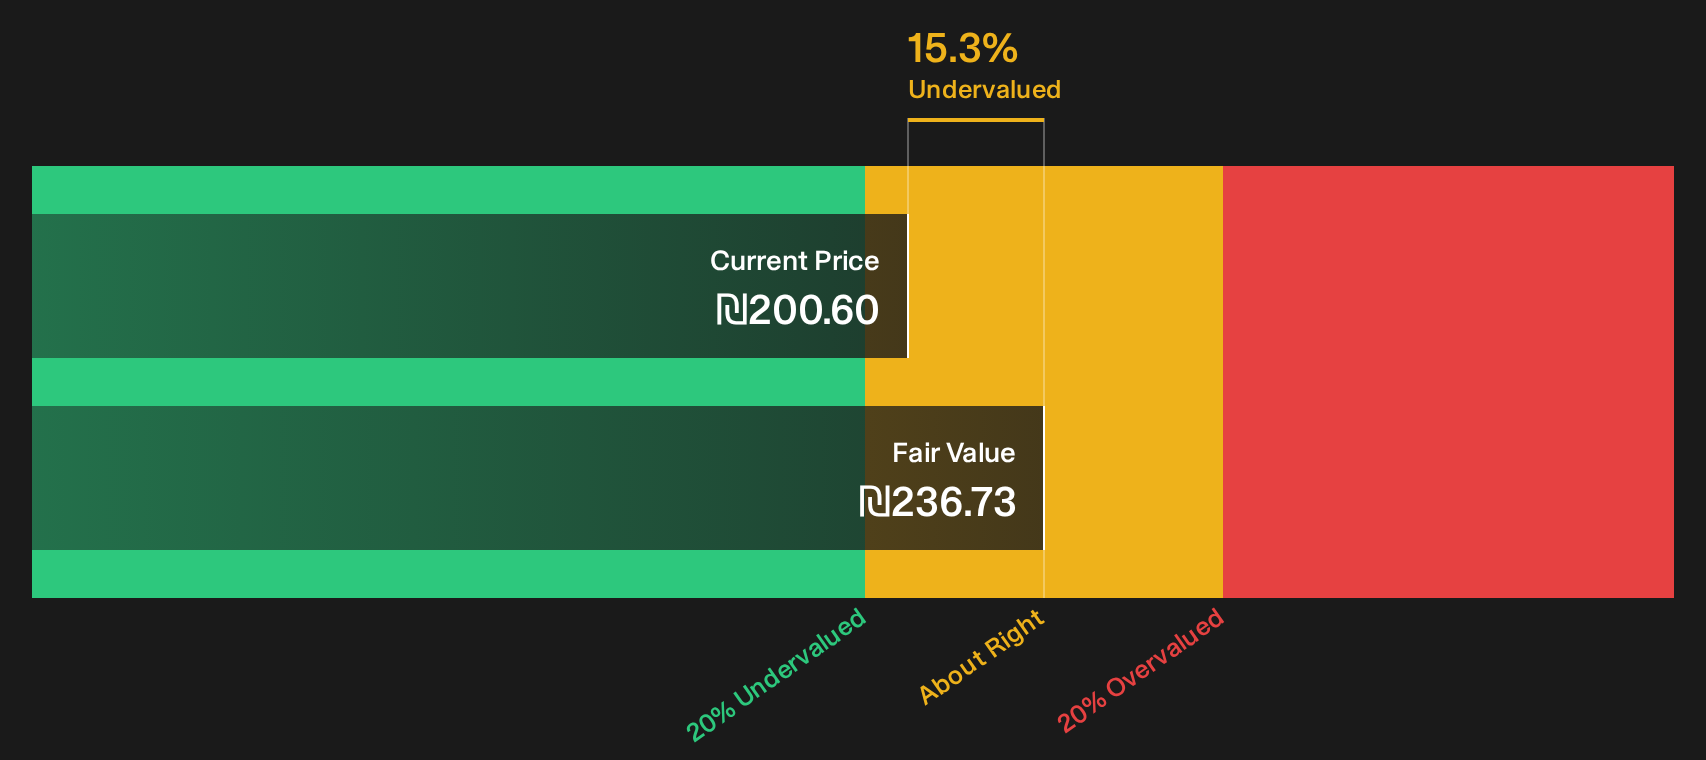
The P/E points one way, but the SWS DCF model points another. On that lens, Kenon Holdings at ₪200.6 is assessed at about 15.3% below an estimated cash flow value of ₪236.73. That suggests the market price may be lagging the model. Which signal matters more to you?
Look into how the SWS DCF model arrives at its fair value.
Simply Wall St performs a discounted cash flow (DCF) on every stock in the world every day (check out Kenon Holdings for example). We show the entire calculation in full. You can track the result in your watchlist or portfolio and be alerted when this changes, or use our stock screener to discover 174 high quality undervalued stocks. If you save a screener we even alert you when new companies match - so you never miss a potential opportunity.
Next Steps
Sentiment around Kenon Holdings is clearly mixed, with fresh financial progress already baked into the price in some investors’ eyes. Act while the data is still current and stress test the story for yourself by weighing its 1 key reward and 3 important warning signs.
Looking for more investment ideas beyond Kenon Holdings?
Do not stop your research with Kenon Holdings. Use fresh screens to spot other opportunities that match your goals before the crowd pays attention.
- Target quality at a discount by checking companies that screen well on valuation and fundamentals through the 174 high quality undervalued stocks.
- Build a portfolio with staying power by scanning income opportunities using the 161 dividend fortresses.
- Prioritise resilience and sleep easier at night by focusing on companies highlighted in the 229 resilient stocks with low risk scores.
This article by Simply Wall St is general in nature. We provide commentary based on historical data and analyst forecasts only using an unbiased methodology and our articles are not intended to be financial advice. It does not constitute a recommendation to buy or sell any stock, and does not take account of your objectives, or your financial situation. We aim to bring you long-term focused analysis driven by fundamental data. Note that our analysis may not factor in the latest price-sensitive company announcements or qualitative material. Simply Wall St has no position in any stocks mentioned.
Have feedback on this article? Concerned about the content? Get in touch with us directly. Alternatively, email editorial-team@simplywallst.com