


Discover 3 Asian Stocks Including ZhongAn Online P & C Insurance That May Be Trading Below Estimated Fair Value
As Asian markets navigate a landscape marked by fluctuating energy prices and evolving monetary policies, investors are increasingly seeking opportunities in stocks that might be undervalued relative to their intrinsic worth. In this context, identifying stocks that are trading below their estimated fair value can offer potential for growth, particularly as regional economies continue to adapt to global economic shifts.
Top 10 Undervalued Stocks Based On Cash Flows In Asia
| Name | Current Price | Fair Value (Est) | Discount (Est) |
| Wacom (TSE:6727) | ¥842.00 | ¥1598.66 | 47.3% |
| Shizuki Electric (TSE:6994) | ¥1208.00 | ¥2301.32 | 47.5% |
| Rakus (TSE:3923) | ¥1082.00 | ¥2061.30 | 47.5% |
| PAL GROUP Holdings (TSE:2726) | ¥1486.00 | ¥2881.64 | 48.4% |
| Niterra (TSE:5334) | ¥7218.00 | ¥13817.91 | 47.8% |
| Ichikoh Industries (TSE:7244) | ¥565.00 | ¥1074.33 | 47.4% |
| HD Hyundai Energy SolutionsLtd (KOSE:A322000) | ₩118600.00 | ₩223397.20 | 46.9% |
| Dongwon Industries (KOSE:A006040) | ₩35500.00 | ₩70431.14 | 49.6% |
| Cheil Worldwide (KOSE:A030000) | ₩17430.00 | ₩34324.41 | 49.2% |
| AK Medical Holdings (SEHK:1789) | HK$4.915 | HK$9.57 | 48.7% |
Underneath we present a selection of stocks filtered out by our screen.
ZhongAn Online P & C Insurance (SEHK:6060)
Overview: ZhongAn Online P & C Insurance Co., Ltd. is an Internet-based Insurtech company offering internet insurance and insurance IT services in China, with a market cap of approximately HK$17.39 billion.
Operations: The company's revenue segments include CN¥38.68 billion from insurance, CN¥1.30 billion from technology, and CN¥541.73 million from banking services.
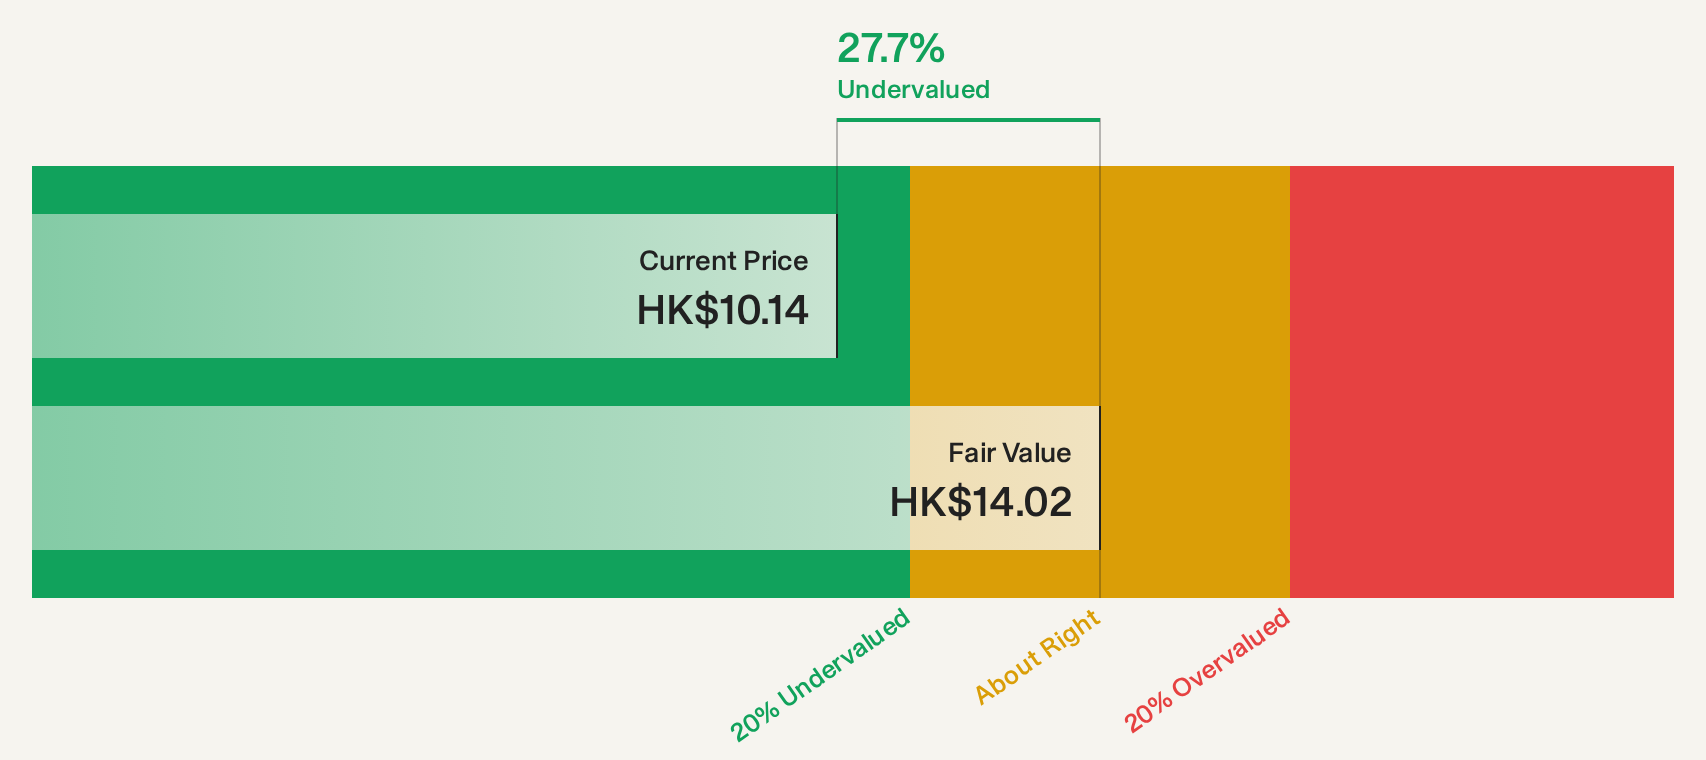
Estimated Discount To Fair Value: 26.5%
ZhongAn Online P & C Insurance is trading at HK$10.32, significantly below its estimated future cash flow value of HK$14.03, suggesting it may be undervalued based on cash flows. Despite a 63.2% earnings growth last year, revenue growth is forecasted to lag behind the Hong Kong market at 5.3% annually, with earnings expected to decline by 6.3% per year over the next three years. Recent half-year results showed net income surged to CNY 1,549.96 million from CNY 667.57 million a year ago.
- Our comprehensive growth report raises the possibility that ZhongAn Online P & C Insurance is poised for substantial financial growth.
- Dive into the specifics of ZhongAn Online P & C Insurance here with our thorough financial health report.
DeHua TB New Decoration MaterialLtd (SZSE:002043)
Overview: DeHua TB New Decoration Material Co., Ltd specializes in the production and sale of furniture boards both domestically in China and internationally, with a market cap of CN¥9.40 billion.
Operations: The company's revenue primarily comes from its Decorative Material Business, which generated CN¥8.08 billion, followed by the Custom Home Business with CN¥1.33 billion.
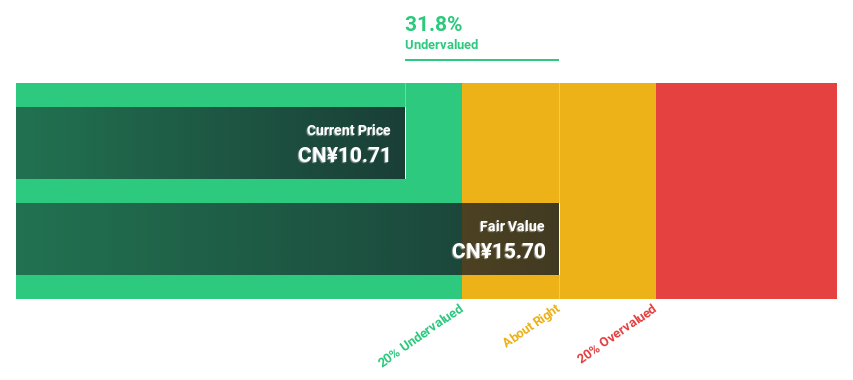
Estimated Discount To Fair Value: 43.9%
DeHua TB New Decoration Material Ltd is trading at CN¥11.47, considerably below its estimated future cash flow value of CN¥20.44, highlighting potential undervaluation based on cash flows. Despite a recent decrease in net income to CNY 247.31 million from CNY 267.85 million last year, the company's earnings are forecasted to grow annually by 16.47%. However, revenue and profit growth rates are expected to be slower than the Chinese market averages.
- Our expertly prepared growth report on DeHua TB New Decoration MaterialLtd implies its future financial outlook may be stronger than recent results.
- Click to explore a detailed breakdown of our findings in DeHua TB New Decoration MaterialLtd's balance sheet health report.
Anker Innovations Technology (SZSE:300866)
Overview: Anker Innovations Technology Co., Ltd. designs, manufactures, and sells consumer electronics and has a market capitalization of approximately CN¥73.97 billion.
Operations: The company's revenue is primarily derived from three segments: Smart Innovation Products at CN¥9.21 billion, Rechargeable Energy Storage at CN¥17.52 billion, and Smart Audio and Video Products at CN¥7.52 billion.
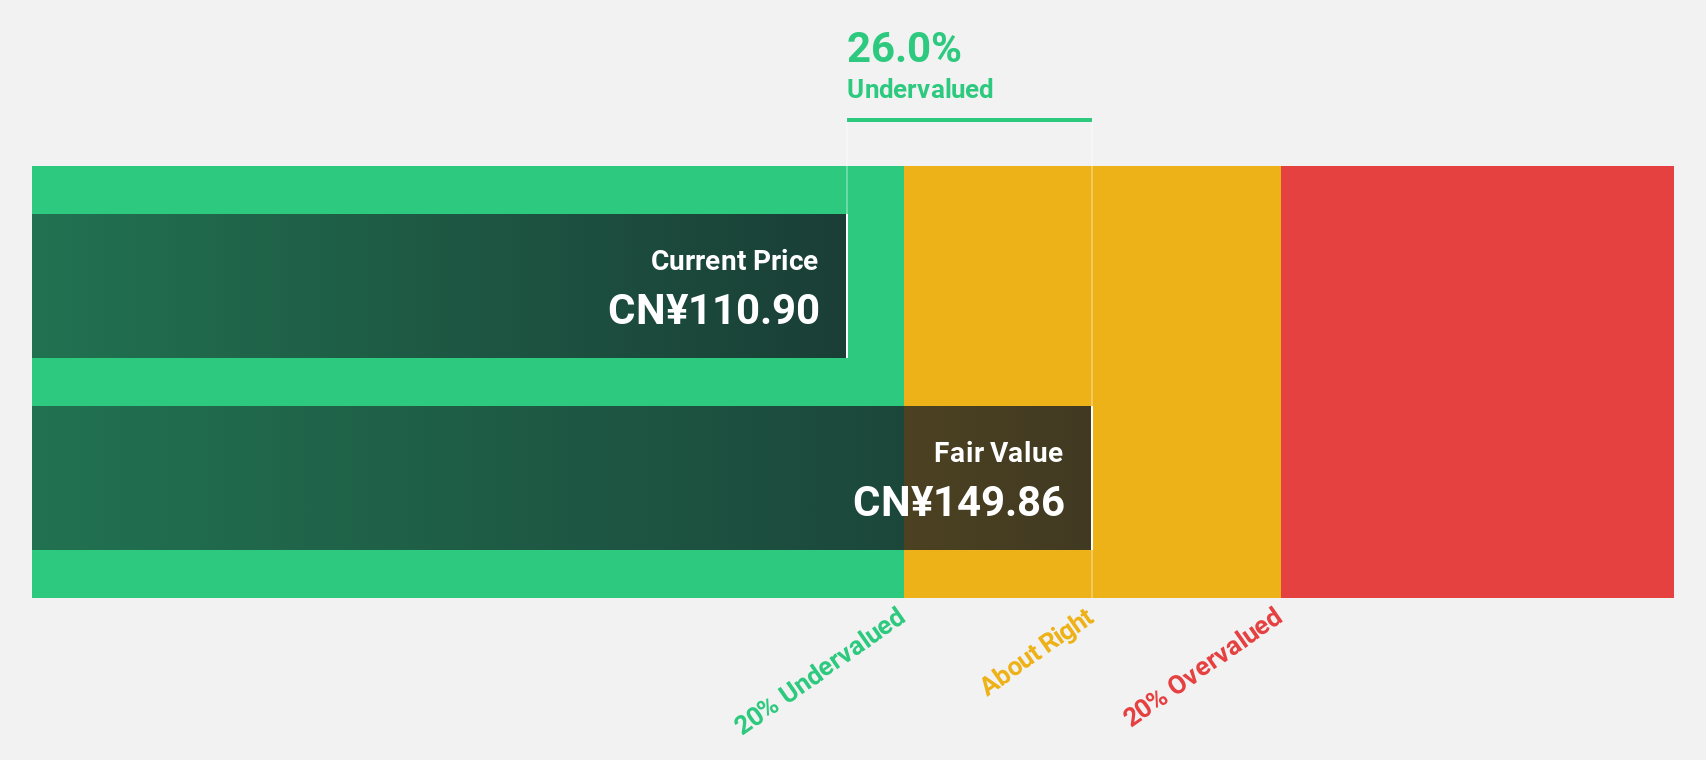
Estimated Discount To Fair Value: 35.5%
Anker Innovations Technology is trading at CN¥128.15, significantly below its estimated future cash flow value of CN¥198.55, indicating potential undervaluation based on cash flows. Earnings grew 27.9% last year and are forecast to grow 19.88% annually, albeit slower than the Chinese market average of 27.5%. Despite an unstable dividend track record, recent business expansions and product innovations may enhance long-term growth prospects amidst competitive industry positioning.
- In light of our recent growth report, it seems possible that Anker Innovations Technology's financial performance will exceed current levels.
- Navigate through the intricacies of Anker Innovations Technology with our comprehensive financial health report here.
Make It Happen
- Unlock more gems! Our Undervalued Asian Stocks Based On Cash Flows screener has unearthed 75 more companies for you to explore.Click here to unveil our expertly curated list of 78 Undervalued Asian Stocks Based On Cash Flows.
- Shareholder in one or more of these companies? Ensure you're never caught off-guard by adding your portfolio in Simply Wall St for timely alerts on significant stock developments.
- Join a community of smart investors by using Simply Wall St. It's free and delivers expert-level analysis on worldwide markets.
Ready To Venture Into Other Investment Styles?
- Explore high-performing small cap companies that haven't yet garnered significant analyst attention.
- Diversify your portfolio with solid dividend payers offering reliable income streams to weather potential market turbulence.
- Fuel your portfolio with companies showing strong growth potential, backed by optimistic outlooks both from analysts and management.
This article by Simply Wall St is general in nature. We provide commentary based on historical data and analyst forecasts only using an unbiased methodology and our articles are not intended to be financial advice. It does not constitute a recommendation to buy or sell any stock, and does not take account of your objectives, or your financial situation. We aim to bring you long-term focused analysis driven by fundamental data. Note that our analysis may not factor in the latest price-sensitive company announcements or qualitative material. Simply Wall St has no position in any stocks mentioned.
Have feedback on this article? Concerned about the content? Get in touch with us directly. Alternatively, email editorial-team@simplywallst.com