


Why CRISPR Therapeutics (CRSP) Is Back In The Spotlight
CRISPR Therapeutics (NasdaqGM:CRSP) heads into the Morgan Stanley 24th Annual Global Healthcare Conference on 14 September 2026, giving investors fresh context for a gene editing pipeline that spans hemoglobinopathies, CAR T therapies and type 1 diabetes.
Over the past week, CRISPR Therapeutics has seen a 7-day share price return of 9.36%, even though the 1-month share price return is down 4.94%. The 1-year total shareholder return has declined 9.24%, while the 3-year total shareholder return is up 24.34%, pointing to improving near-term momentum alongside mixed longer-term outcomes.
Scan beyond CRISPR Therapeutics and see how other high potential researchers in the sector line up with the 37 healthcare AI stocks.
After a sharp 7-day rebound but a weaker year-long return, CRISPR Therapeutics now sits at an interesting crossroads. Is most of the upside already captured in the recent move, or does the valuation still leave meaningful headroom?
Preferred Price-to-Book of 3.1x: Is it justified?
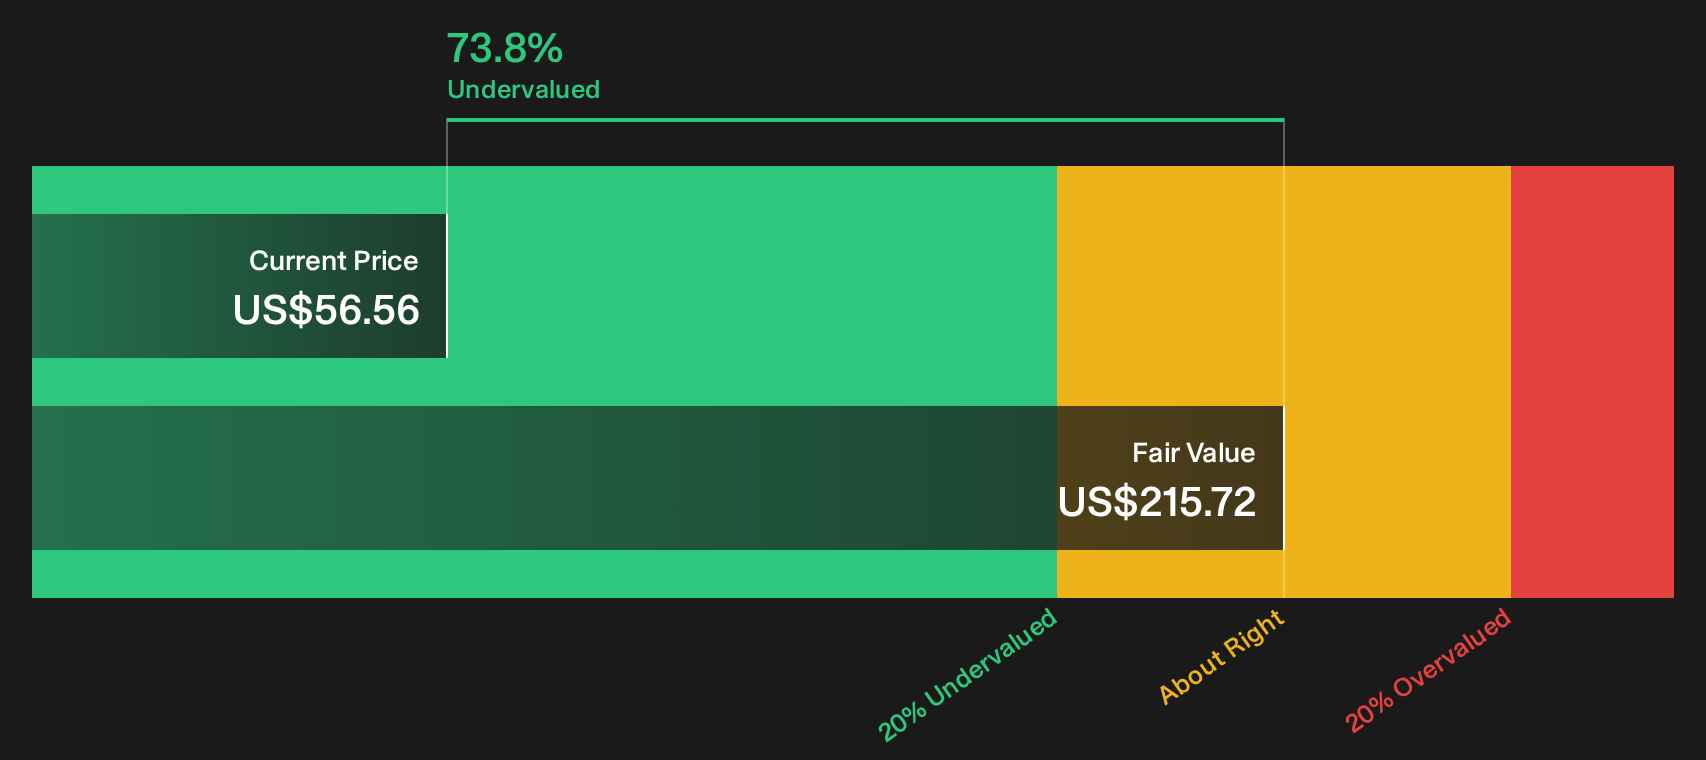
On the numbers provided, CRISPR Therapeutics trades on a P/B of 3.1x, while our DCF model points to a future cash flow value of $215.72 per share against a last close of $56.56. That combination suggests the market price sits well below the SWS estimate of intrinsic worth even as the balance sheet valuation multiple looks moderate.
P/B compares the stock price to the book value of equity on the balance sheet. For a research heavy biotech like CRISPR Therapeutics, this ratio reflects what investors are willing to pay over the net assets backing the business, in effect putting a tag on the cash, intellectual property and pipeline housed inside the company.
Management sits in an interesting spot. The stock is described as trading 73.8% below the SWS fair value estimate, while the P/B of 3.1x is characterized as good value relative to peer averages of 11.5x and more expensive than the broader US biotech group at 2.3x. The gap between the $56.56 price and the $215.72 DCF output indicates that expectations embedded in the current valuation are far more conservative than those embedded in the SWS DCF assumptions.
Compared with sector peers, the contrast is clear. Against a 3.1x P/B at CRISPR Therapeutics, the peer group sits at 11.5x, implying the market assigns a substantially richer premium to many other gene and cell therapy developers than to CRISPR Therapeutics on a pure balance sheet basis, even though the stock screens as more expensive than the broader US biotech industry average of 2.3x.
Result: Price-to-book of 3.1x (UNDERVALUED).
See what the numbers say about this price — find out in our valuation breakdown.
Still, the CRISPR Therapeutics story could be knocked off course if clinical trial outcomes disappoint or if higher than expected cash burn pressures future funding options.
Find out about the key risks to this CRISPR Therapeutics narrative.
Another view on CRISPR Therapeutics valuation
The earlier focus was on CRISPR Therapeutics trading at 3.1x P/B. Using the SWS DCF model gives a very different picture, with a future cash flow value of $215.72 per share against a market price of $56.56. This frames the stock as heavily undervalued on that metric. Which signal should carry more weight for you as an investor?
Look into how the SWS DCF model arrives at its fair value.
Simply Wall St performs a discounted cash flow (DCF) on every stock in the world every day (check out CRISPR Therapeutics for example). We show the entire calculation in full. You can track the result in your watchlist or portfolio and be alerted when this changes, or use our stock screener to discover 35 high quality undervalued stocks. If you save a screener we even alert you when new companies match - so you never miss a potential opportunity.
Next Steps
Curious whether the market is too cautious or simply early on CRISPR Therapeutics, given those mixed performance signals and contrasting valuation tools? Move quickly, review the data for yourself, and stress test your expectations against the 2 key rewards.
Looking for more CRISPR Therapeutics investment ideas?
If CRISPR Therapeutics has sharpened your focus on valuation and risk, do not stop here. Broaden your watchlist with targeted screens that surface fresh opportunities fast.
- Target potential mispriced opportunities by scanning a curated 35 high quality undervalued stocks that filters for quality alongside attractive valuations.
- Prioritise resilience in choppy markets by reviewing a 30 resilient stocks with low risk scores that screens for businesses with stronger stability profiles.
- Spot potential early movers by checking a 16 high quality undiscovered gems designed to highlight companies with solid fundamentals that the crowd may be overlooking.
This article by Simply Wall St is general in nature. We provide commentary based on historical data and analyst forecasts only using an unbiased methodology and our articles are not intended to be financial advice. It does not constitute a recommendation to buy or sell any stock, and does not take account of your objectives, or your financial situation. We aim to bring you long-term focused analysis driven by fundamental data. Note that our analysis may not factor in the latest price-sensitive company announcements or qualitative material. Simply Wall St has no position in any stocks mentioned.
Have feedback on this article? Concerned about the content? Get in touch with us directly. Alternatively, email editorial-team@simplywallst.com