


Is Azbil (TSE:6845) Undervalued Or Are Its Quality Shares Already Fully Valued?
Recent trading in Azbil (TSE:6845) has drawn attention after a choppy few months, with the stock down about 3% over the past month and roughly 14% over the past 3 months.
Viewed over a slightly longer stretch, Azbil’s 90 day share price return has fallen 14.25%, which contrasts with a mildly positive year to date share price gain of 1.90% and a broadly flat 1 year total shareholder return of 0.18%. This suggests momentum has been fading even though longer term holders still show a 31.68% 3 year total shareholder return and a 24.61% 5 year total shareholder return.
Compare Azbil's recent pullback with peers by scanning 95 robotics and automation stocks that could be setting up for the next leg of automation-driven growth.
Azbil looks like a solid automation business on paper, yet the recent pullback raises a sharper issue. Are you paying a fair price for that quality today, or already paying up?
Most Popular Narrative: 15% Undervalued
Azbil’s most followed valuation narrative puts fair value at ¥1,710, slightly above the last close of ¥1,450.5. This frames the recent pullback as a question of whether the market is undervaluing steady but unspectacular growth.
Higher shareholder returns via sustained dividend increases and sizable share buybacks, together with treasury share utilization, reduce balance sheet flexibility for large-scale overseas expansion or acquisitions. This could potentially moderate long term revenue and earnings growth.
See why 1 investors see Azbil as 15% undervalued.
Result: Fair Value of ¥1,710 (UNDERVALUED)
Still, the Azbil story could change quickly if Building Automation demand stays stronger for longer or if Life Automation gains traction from smart meter and cloud service projects.
Find out about the key risks to this Azbil narrative.
Another View On Azbil’s Valuation
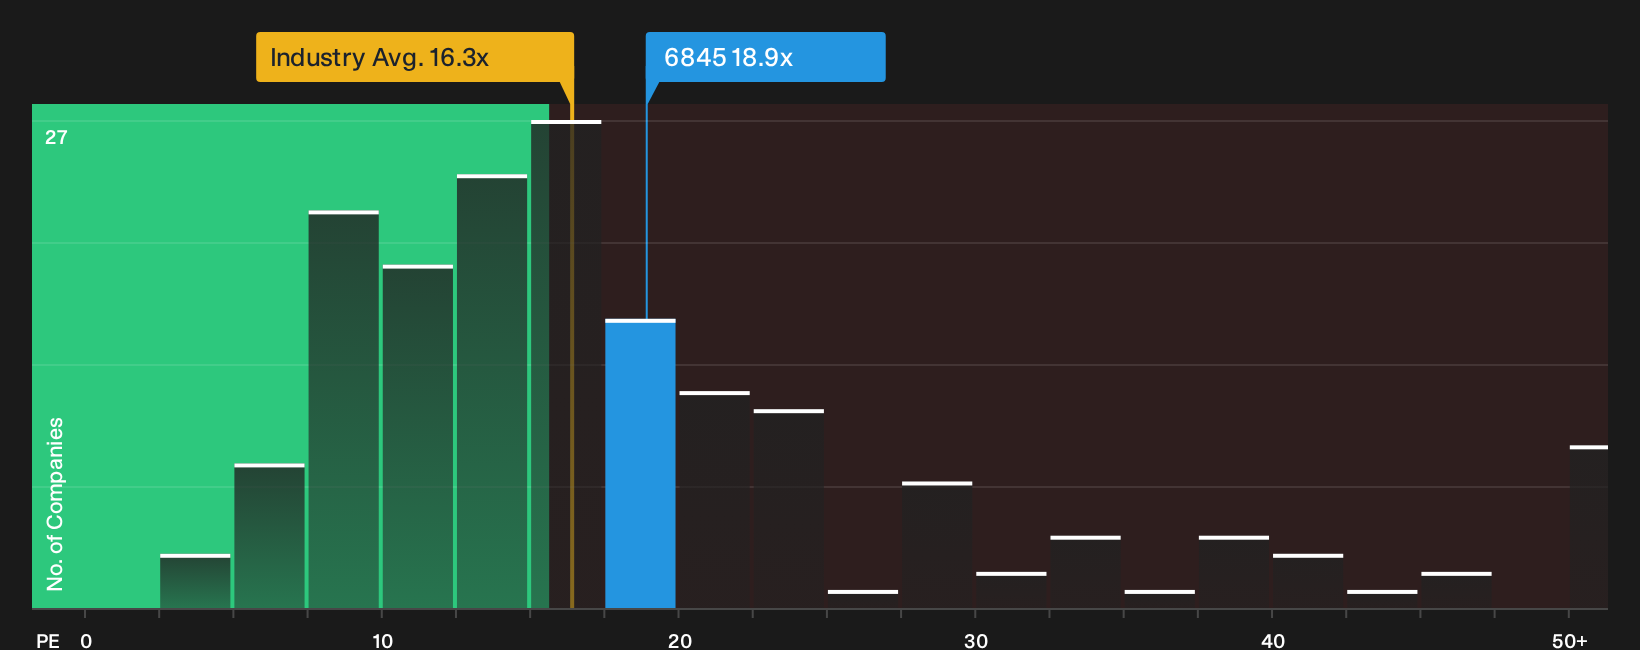
There is a different signal once you look at Azbil through simple earnings multiples instead of the fair value narrative. The stock trades on a P/E of 18.9x, richer than the JP Electronic industry at 16.3x and above a fair ratio estimate of 15.6x. That points to less margin of safety and more valuation risk than the 15% undervalued story suggests. So is the crowd leaning too hard on the quality premium here, or are the models underpricing that track record?
To see how those earnings multiples stack up against peers and what that gap might mean for future upside or downside, See what the numbers say about this price — find out in our valuation breakdown.
Next Steps
Sentiment around Azbil is clearly mixed, so it helps to move past the headlines, review the data and form a view quickly. To see both sides of that debate in one place, including the potential upside and the key concerns, check out the 1 key reward and 1 important warning sign.
Looking for more investment ideas beyond Azbil?
You have a handle on Azbil. Now broaden your watchlist with a few carefully filtered ideas that match different goals, risk levels and income needs.
- Target potential mispricing by scanning a focused set of quality opportunities through the 17 high quality undervalued stocks.
- Prioritise resilience and capital preservation by reviewing companies that feature in the 21 resilient stocks with low risk scores.
- Hunt for future leaders early by checking companies highlighted as 75 high quality undiscovered gems.
This article by Simply Wall St is general in nature. We provide commentary based on historical data and analyst forecasts only using an unbiased methodology and our articles are not intended to be financial advice. It does not constitute a recommendation to buy or sell any stock, and does not take account of your objectives, or your financial situation. We aim to bring you long-term focused analysis driven by fundamental data. Note that our analysis may not factor in the latest price-sensitive company announcements or qualitative material. Simply Wall St has no position in any stocks mentioned.
Have feedback on this article? Concerned about the content? Get in touch with us directly. Alternatively, email editorial-team@simplywallst.com