


Empire (TSX:EMP.A) Dropped, What Is Behind The Move?
Empire (TSX:EMP.A) set its next payout in motion after the board declared a quarterly dividend of CA$0.2425 per share on both Class A and Class B shares, payable October 30, 2026.
That dividend decision lands as Empire’s share price sits at CA$45.83, with the 1 day share price return down 3.41% and the 90 day share price return down 8.69%, while the 3 year total shareholder return of 30.98% points to stronger longer term momentum than the recent drift suggests.
Scan how Empire’s dividend profile compares with other income-focused opportunities by reviewing the hand-picked 1 dividend fortresses in the market right now.
Empire now trades below the average analyst target, yet the recent share price slide signals caution. Is the market correctly pricing that concern, or is it overdoing the discount to fair value?
Preferred P/E of 46.8x for Empire: Is it justified?
Empire trades on a P/E of 46.8x against a last close of CA$45.83, while both its own earnings history and peer comparisons point to a demanding valuation rather than a clear bargain.
The P/E ratio compares the current share price to earnings per share and gives you a quick read on how much investors are paying for each dollar of profit. For a mature food retail group like Empire, a high P/E often signals that the market is willing to pay up for perceived resilience, brand strength, or a cleaner earnings profile.
The underlying profit picture is not straightforward. Earnings have declined by 12.4% per year over the past 5 years, and profit margins sit at 0.7% compared with 2.2% a year ago. On top of that, the latest 12 month figures include a large one off loss of CA$705.0m, which clouds the quality of recent earnings and makes the high multiple harder to interpret as pure confidence in growth.
Peer context is even tougher. Empire is described as expensive on a P/E of 46.8x compared with its direct peer average of 27.1x, and it is also labelled expensive versus the wider North American consumer retailing industry at 19.6x. That means investors are paying a materially richer price tag for Empire than for many comparable retailers, even as its earnings have moved in the opposite direction and its Return on Equity of 5% is flagged as low.
See what the numbers say about this price — find out in our valuation breakdown.
Result: Price-to-Earnings of 46.8x (OVERVALUED).
Still, Empire carries clear pressure points, including earnings that declined 12.4% annually over 5 years and a recent CA$705.0m one off loss that could reshape investor confidence.
Find out about the key risks to this Empire narrative.
Another View on Empire’s value
The earlier P/E discussion painted Empire as expensive, yet the SWS DCF model points the other way. On that framework, the estimated future cash flow value sits at CA$32.28 per share, while the current price is CA$45.83. That gap raises a blunt question: Is Empire simply priced too rich for the cash it is expected to generate?
Look into how the SWS DCF model arrives at its fair value.
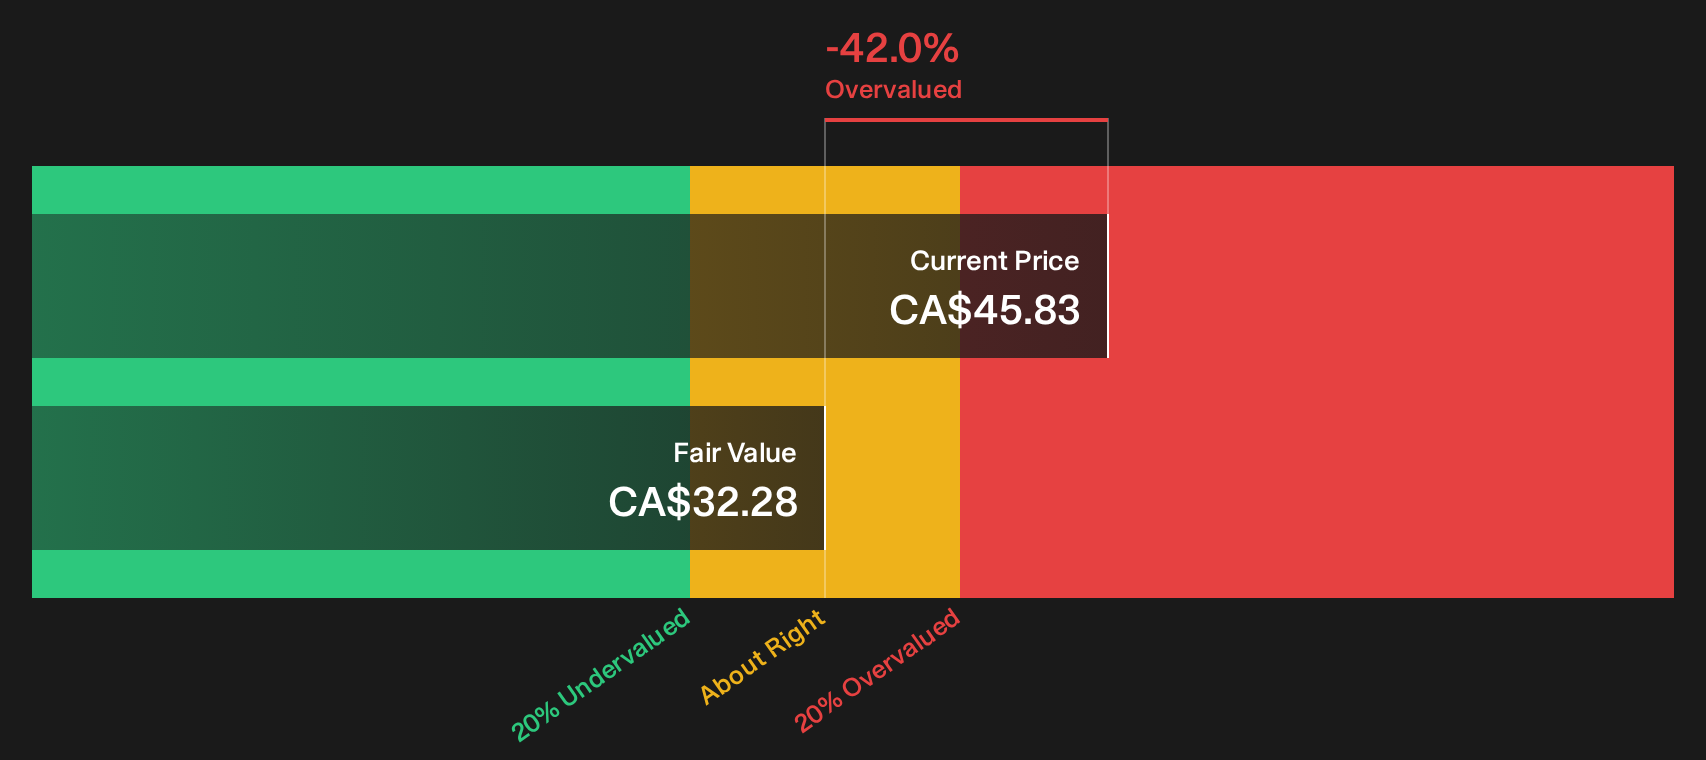
Simply Wall St performs a discounted cash flow (DCF) on every stock in the world every day (check out Empire for example). We show the entire calculation in full. You can track the result in your watchlist or portfolio and be alerted when this changes, or use our stock screener to discover 4 high quality undervalued stocks. If you save a screener we even alert you when new companies match - so you never miss a potential opportunity.
Next Steps
With the tone of this Empire review feeling cautious, you should still move quickly, test the numbers yourself, and weigh the 4 important warning signs.
Looking for more Empire alternatives and fresh ideas?
If Empire leaves you on the fence, do not sit still. Use that instinct as a prompt to widen your opportunity set and pressure test your watchlist.
- Target dependable income streams by reviewing the 1 dividend fortresses that might suit a more defensive part of your portfolio.
- Hunt for potential mispricing by checking the 4 high quality undervalued stocks that combine quality fundamentals with compressed expectations.
- Secure a sturdier core with the list of solid balance sheet and fundamentals (7 results) so short term swings do not dictate your long term plan.
This article by Simply Wall St is general in nature. We provide commentary based on historical data and analyst forecasts only using an unbiased methodology and our articles are not intended to be financial advice. It does not constitute a recommendation to buy or sell any stock, and does not take account of your objectives, or your financial situation. We aim to bring you long-term focused analysis driven by fundamental data. Note that our analysis may not factor in the latest price-sensitive company announcements or qualitative material. Simply Wall St has no position in any stocks mentioned.
Have feedback on this article? Concerned about the content? Get in touch with us directly. Alternatively, email editorial-team@simplywallst.com