


Vaxcyte (PCVX) Could Be 71% Below Fair Value Following A Valuation Split
Vaxcyte (PCVX) has drawn fresh attention after its share price closed at $58.13, with returns down 7.2% over the past month and up 11.6% in the past 3 months.
Recent trading has cooled some of Vaxcyte’s momentum, with the share price down over the past week and month. However, the year-to-date share price return of 25.12% and 1-year total shareholder return of 83.09% still point to strong longer-term gains.
Scan beyond Vaxcyte and compare its recent swings with a hand picked set of resilient healthcare names using the 30 resilient stocks with low risk scores
Vaxcyte now trades at a steep discount to both analyst targets and one intrinsic value estimate, even after a powerful 1 year run. Is that a genuine mispricing, or is the market quietly flagging risk?
Preferred Price-to-Book Multiple of 3.1x: Is it justified?
Valuation work on Vaxcyte points in two very different directions. On one side, the stock trades at a P/B ratio of 3.1x, which screens as good value against a peer group average of 11.2x. On the other side, the same 3.1x looks expensive compared with the broader US biotechs sector, where the average is 2.3x.
P/B compares the share price with the accounting value of net assets per share. For an early stage vaccine developer like Vaxcyte, that often means investors are placing a price on future projects and intellectual property rather than current earnings, especially given that the business reported a loss of $1,064.261m and has less than $1m in revenue.
Compared with its closer peer set, Vaxcyte trades on a markedly lower P/B multiple, which suggests the market is attaching a smaller premium to its pipeline and balance sheet than to similar biotechs. Against the wider industry, however, the higher P/B ratio signals that the stock carries a richer tag than the typical US biotech, so the current valuation asks investors to accept a higher price relative to book value than the sector average.
See what the numbers say about this price — find out in our valuation breakdown.
Result: Price-to-book ratio of 3.1x (ABOUT RIGHT).
Still, Vaxcyte’s lack of revenue, combined with a US$1,064.261m loss and reliance on successful vaccine trial outcomes, could quickly challenge any “discount” valuation story.
Find out about the key risks to this Vaxcyte narrative.
Another view on Vaxcyte’s value
The earlier P/B work presents Vaxcyte as roughly fairly priced against some benchmarks. A different lens suggests a notably different picture. The SWS DCF model estimates future cash flow value at $202.46 per share, compared with the current $58.13 price, which indicates a substantial discount.
If that difference reflects cautious assumptions that later prove conservative, investors may be observing a significant potential value gap. If it reflects real execution or funding risk, the discount may represent compensation for those hazards. Which side of that trade do you think the market has right today?
Look into how the SWS DCF model arrives at its fair value.
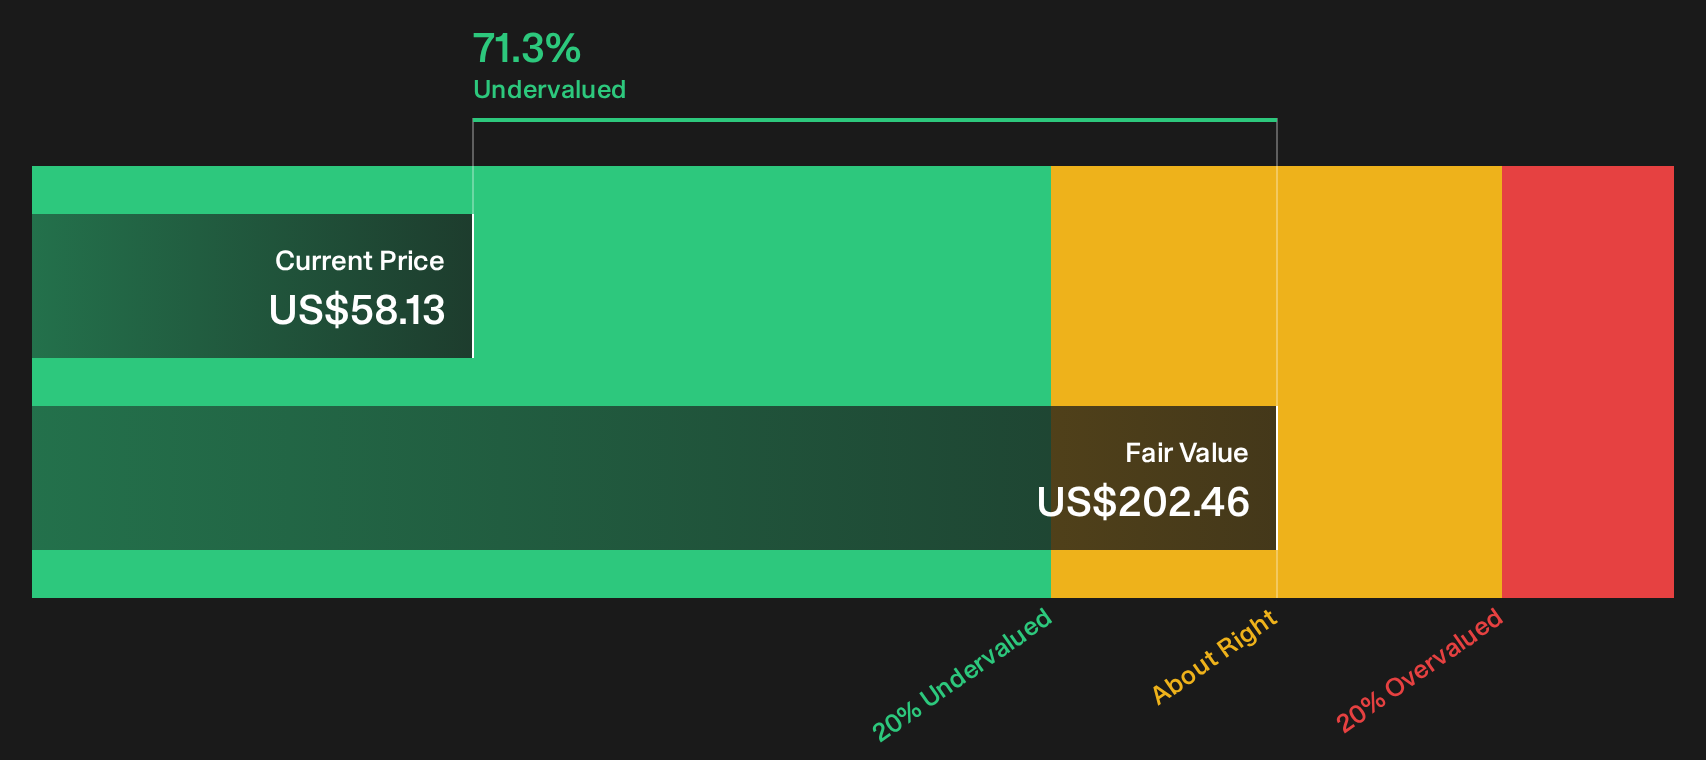
Simply Wall St performs a discounted cash flow (DCF) on every stock in the world every day (check out Vaxcyte for example). We show the entire calculation in full. You can track the result in your watchlist or portfolio and be alerted when this changes, or use our stock screener to discover 35 high quality undervalued stocks. If you save a screener we even alert you when new companies match - so you never miss a potential opportunity.
Next Steps
Mixed signals around Vaxcyte can feel confusing, so move quickly, review the underlying figures yourself, then weigh up the 2 key rewards and 2 important warning signs
Looking for more investment ideas beyond Vaxcyte?
If Vaxcyte has sharpened your focus on valuation and risk, do not stop there. Use curated stock lists to pressure test your thinking across more opportunities.
- Target potential mispricings by scanning a focused set of companies that combine quality fundamentals with attractive valuations using the 35 high quality undervalued stocks.
- Strengthen capital preservation by filtering for businesses with robust financial footing through the list of solid balance sheet and fundamentals (23 results).
- Explore potential future market favorites before they gain wider attention by reviewing the 16 high quality undiscovered gems.
This article by Simply Wall St is general in nature. We provide commentary based on historical data and analyst forecasts only using an unbiased methodology and our articles are not intended to be financial advice. It does not constitute a recommendation to buy or sell any stock, and does not take account of your objectives, or your financial situation. We aim to bring you long-term focused analysis driven by fundamental data. Note that our analysis may not factor in the latest price-sensitive company announcements or qualitative material. Simply Wall St has no position in any stocks mentioned.
Have feedback on this article? Concerned about the content? Get in touch with us directly. Alternatively, email editorial-team@simplywallst.com