


Is Jefferies Financial Group (JEF) A Bargain After Oppenheimer Backed Its Banking Outlook?
Jefferies Financial Group (JEF) is back in focus after Oppenheimer highlighted rising demand for its advisory and underwriting work, pointing investors toward the group’s investment banking and capital markets outlook.
Jefferies Financial Group’s share price has pulled back to US$47.90, with the stock falling about 11% over the past month and roughly 25% year to date. However, the 3-year total shareholder return of about 40% and 5-year total shareholder return of about 56% point to stronger longer-run momentum that contrasts with recent weakness, as investors weigh the upbeat advisory outlook against a series of routine fixed income offerings announced this week.
Capitalize on the renewed focus around Jefferies Financial Group by scanning a curated set of other investment banking and capital markets players in our 16 high quality undiscovered gems.After a sharp pullback yet a still solid multi year return profile, Jefferies Financial Group now sits in a grey zone where investors have to decide whether recent weakness sets up further upside ahead or signals that the easy gains are already behind it.
Price-to-Earnings of 13.8x: Is it justified?
Jefferies Financial Group currently trades on a P/E of 13.8x, which sits below both peer and industry averages, even after the recent share price pullback to $47.90.
The P/E ratio compares what investors pay today for each dollar of earnings. For a diversified capital markets and investment banking group like Jefferies Financial Group, this metric often reflects expectations around deal activity, trading income, and how durable current profitability looks across cycles.
Jefferies Financial Group screens as "good value" on several checks. Its 13.8x P/E is lower than the US Capital Markets industry average of 39.6x and below the peer average of 14.6x. It also sits under an estimated fair P/E of 15.2x. This is a level the market could move toward if recent 38.6% earnings growth and improving net profit margins at 9.6% versus 8.4% last year remain supported by its advisory and underwriting franchise.
Explore the SWS fair ratio for Jefferies Financial Group.
Result: Price-to-Earnings of 13.8x (UNDERVALUED)
Still, Jefferies Financial Group remains exposed to swings in deal activity and trading volumes, and any slowdown in those areas could quickly challenge the current valuation story.
Find out about the key risks to this Jefferies Financial Group narrative.
Another View: SWS DCF check on Jefferies Financial Group
While the P/E workup suggests Jefferies Financial Group looks inexpensive, the SWS DCF model is more muted. It points to a future cash flow value of about $49.03 per share versus the current $47.90 price. This implies only a small margin of undervaluation for investors to work with.
Look into how the SWS DCF model arrives at its fair value.
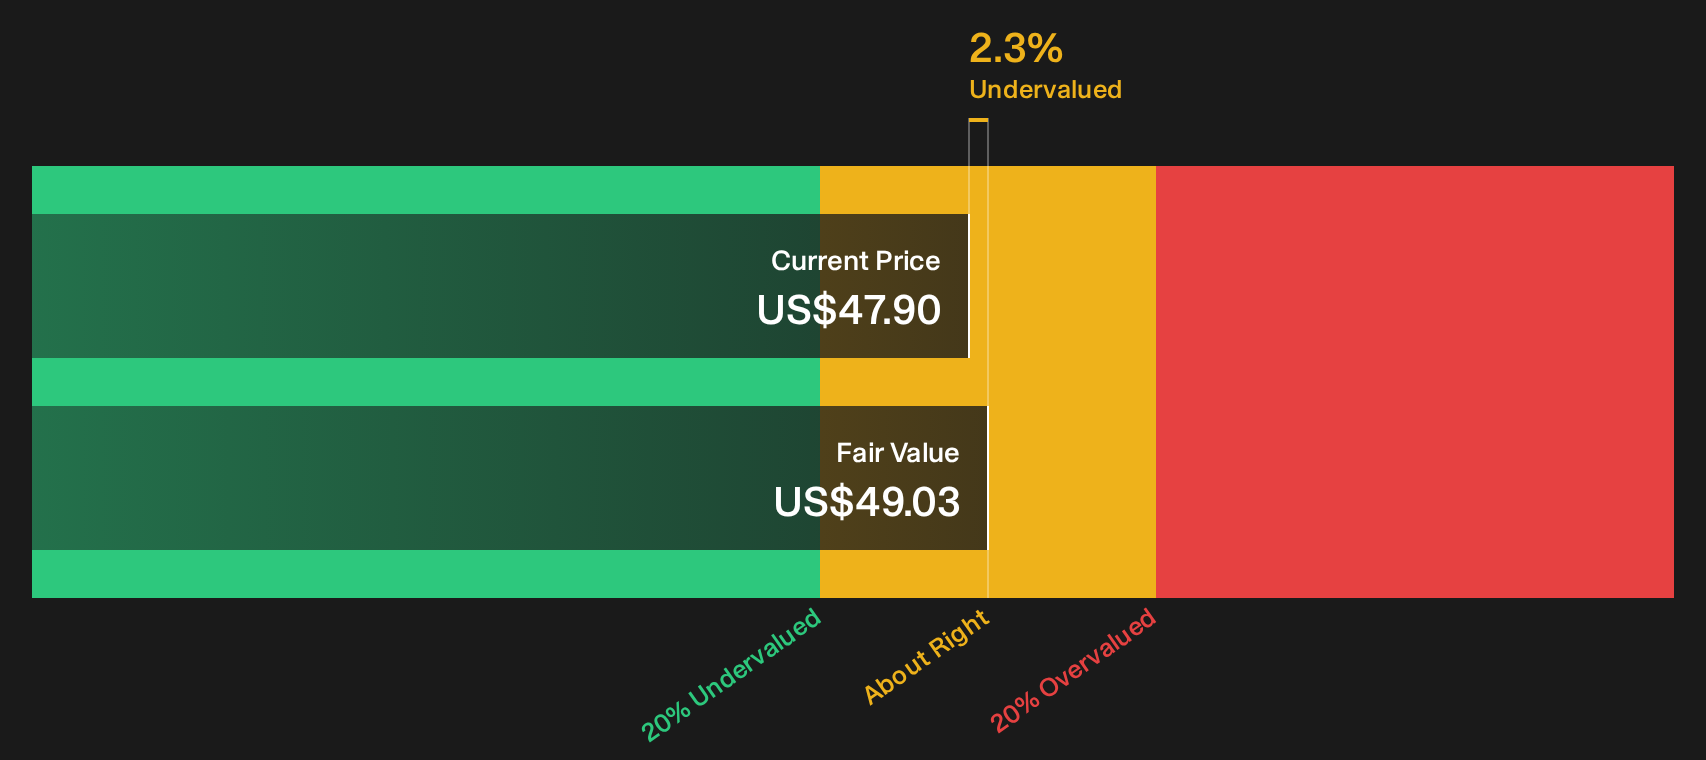
Simply Wall St performs a discounted cash flow (DCF) on every stock in the world every day (check out Jefferies Financial Group for example). We show the entire calculation in full. You can track the result in your watchlist or portfolio and be alerted when this changes, or use our stock screener to discover 33 high quality undervalued stocks. If you save a screener we even alert you when new companies match - so you never miss a potential opportunity.
Next Steps
Feeling that the Jefferies Financial Group story could go either way from here. Act while the details are fresh and weigh the upside drivers yourself through the 5 key rewards.
Want more ideas beyond Jefferies Financial Group?
If Jefferies Financial Group has you thinking harder about where to put fresh capital, do not stop at a single ticker when the field is this wide.
- Target resilient balance sheets and steady fundamentals by scanning the list of solid balance sheet and fundamentals (23 results), which filters for financial strength up front.
- Hunt for quality at a discount by running through the 33 high quality undervalued stocks so you are not guessing which stocks might be mispriced.
- Seek reliable income ideas by checking the 6 dividend fortresses and focus on companies built to support higher yield payouts.
This article by Simply Wall St is general in nature. We provide commentary based on historical data and analyst forecasts only using an unbiased methodology and our articles are not intended to be financial advice. It does not constitute a recommendation to buy or sell any stock, and does not take account of your objectives, or your financial situation. We aim to bring you long-term focused analysis driven by fundamental data. Note that our analysis may not factor in the latest price-sensitive company announcements or qualitative material. Simply Wall St has no position in any stocks mentioned.
Have feedback on this article? Concerned about the content? Get in touch with us directly. Alternatively, email editorial-team@simplywallst.com