


Amerigo Resources (TSX:ARG) Climbed, What Is Behind The Latest Attention?
Amerigo Resources performance dividend and investor focus
Amerigo Resources (TSX:ARG) has put income front and center after its Board declared a CAD 0.21 per share performance dividend, payable on October 14, 2026, to holders of record on September 21.
This special payout gives investors fresh information about how management is choosing to use surplus cash, and it offers a new reference point for assessing Amerigo Resources alongside its recent share price gains.
Amerigo Resources has seen strong momentum build, with the share price at CA$8.93 and a 30-day share price return of 19.54% adding to a 99.33% year-to-date move. The 1-year total shareholder return of 306.05% and 5-year total shareholder return of over 10x suggest the recent performance dividend news is landing on top of already very strong investor gains.
Scan beyond Amerigo Resources and line up other income focused plays using our curated list of 1 dividend fortresses as potential comps.
Amerigo Resources now trades close to analyst targets, yet the implied intrinsic value points much lower. After such a sharp move and a fresh performance dividend, the key question is where fair value really sits in that spread.
Price-to-earnings of 17.9x for Amerigo Resources: Is it justified?
Amerigo Resources trades on a P/E of 17.9x, and that valuation sits below the 26.4x average for peers even as the stock price has rallied to CA$8.93.
The P/E multiple compares the current share price to the firm’s earnings per share and provides a quick shorthand for how much investors are paying for each dollar of profit. For a copper producer like Amerigo Resources, this lens matters because earnings can vary with commodity cycles, contract terms and operating leverage.
On these numbers, the P/E suggests the market is assigning a lower earnings multiple than the broader peer set while still pricing Amerigo Resources slightly above the Canadian Metals and Mining industry average of 17x. That mix points to investors paying a bit more relative to the industry group but not as much as they do for the wider peer sample.
Compared with the sector benchmark, the 17.9x P/E is only modestly higher than the 17x industry level, so the stock appears close to in line rather than deeply cheap or stretched on this preferred earnings yardstick.
See what the numbers say about this price — find out in our valuation breakdown.
Result: Price-to-earnings of 17.9x (ABOUT RIGHT)
Still, Amerigo Resources faces clear pressure points, including declining annual revenue growth, as well as reliance on a single Chilean operation and tolling partner as key swing factors.
Find out about the key risks to this Amerigo Resources narrative.
Another view on Amerigo Resources valuation
The SWS DCF model paints a very different picture for Amerigo Resources. At CA$8.93, the stock is described as trading above an estimated future cash flow value of CA$3.91, which frames the shares as expensive using this cash flow lens.
The wide gap between the market price and the CA$3.91 DCF estimate highlights valuation risk rather than upside, since it implies investors are paying well above what the model suggests for Amerigo Resources’ future cash generation. It raises a simple question: which yardstick will matter more over time, earnings multiples or cash flows?
Look into how the SWS DCF model arrives at its fair value.
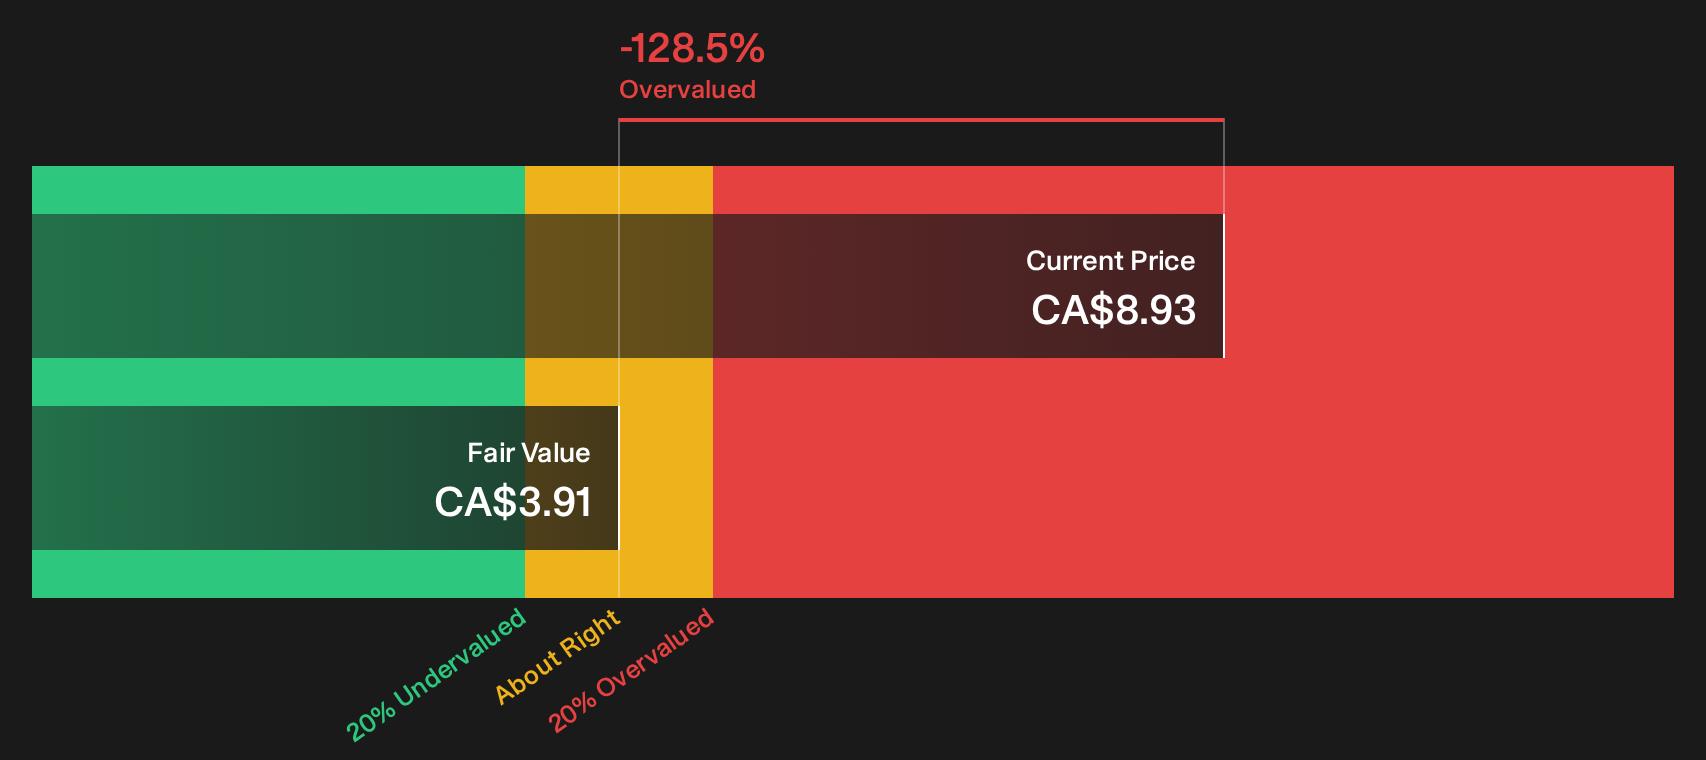
Simply Wall St performs a discounted cash flow (DCF) on every stock in the world every day (check out Amerigo Resources for example). We show the entire calculation in full. You can track the result in your watchlist or portfolio and be alerted when this changes, or use our stock screener to discover 4 high quality undervalued stocks. If you save a screener we even alert you when new companies match - so you never miss a potential opportunity.
Next Steps
Mixed signals on Amerigo Resources valuation and risk reward can feel uncomfortable. Move quickly, review the underlying numbers for yourself, and then weigh the 1 key reward and 2 important warning signs.
Looking for more Amerigo Resources style investment ideas?
If Amerigo Resources has sharpened your focus on risk reward, do not stop here. Fresh opportunities often appear first in focused screeners, not headlines.
- Target resilient compounding potential by scanning a curated pool of 4 high quality undervalued stocks that pair quality fundamentals with more modest pricing.
- Protect your downside first by filtering for 8 resilient stocks with low risk scores where balance sheet strength and stability take priority over story alone.
- Get ahead of the crowd by searching through 9 high quality undiscovered gems that combine solid numbers with limited current market attention.
This article by Simply Wall St is general in nature. We provide commentary based on historical data and analyst forecasts only using an unbiased methodology and our articles are not intended to be financial advice. It does not constitute a recommendation to buy or sell any stock, and does not take account of your objectives, or your financial situation. We aim to bring you long-term focused analysis driven by fundamental data. Note that our analysis may not factor in the latest price-sensitive company announcements or qualitative material. Simply Wall St has no position in any stocks mentioned.
Have feedback on this article? Concerned about the content? Get in touch with us directly. Alternatively, email editorial-team@simplywallst.com