


Hornbeck Offshore Services (HOS) Faces A Fresh Valuation Test As New $1.13b Shelf Lands
Hornbeck Offshore Services (HOS) filed a new omnibus shelf registration on 15 September 2026, covering up to US$1.13b of common stock, preferred shares, warrants, and units for potential future financing flexibility.
Hornbeck Offshore Services shares closed at US$8.58 on 17 September 2026, with the 1-day share price return down 0.46% and the year to date share price return down 16.94%. This suggests momentum has been fading even as the new US$1.13b shelf registration adds fresh attention to the equity story.
Scan beyond Hornbeck Offshore Services and compare its financing playbook with a curated list of solid balance sheet and fundamentals (23 results) that may be better positioned for the next capital raising cycle.
Hornbeck Offshore Services now sits at an awkward crossroads, where a weaker share price and a large financing shelf can either signal business reality or just cooler sentiment. The valuation work starts with separating those two stories.
Preferred P/E of 21.3x for Hornbeck Offshore Services: Is it justified?
On valuation, Hornbeck Offshore Services trades on a P/E of 21.3x, which sits below both the US Energy Services sector and its peer group. With the stock at $8.58 on 17 September 2026 and our platform indicating it trades 74.1% below an internal fair value estimate, the current earnings multiple points to a market that is pricing the equity more cautiously than those reference groups.
The P/E ratio compares what investors are paying for each dollar of current earnings. It is a simple way to gauge how the market is weighing Hornbeck Offshore Services against other operators. For a marine services provider tied to offshore activity, this metric often reflects how durable investors think its profits are and how much volatility they are prepared to tolerate in future cash generation.
Context matters here. HOS is reported to have high quality earnings and a high Return on Equity of 21.3%, while earnings grew 4.5% over the past year and have expanded at 31.9% per year over the past five years. Against that backdrop, a 21.3x P/E that sits below the US Energy Services industry average of 24.7x and well below a 40.3x peer average suggests the market is assigning a discount to those earnings, even as revenue is forecast to advance 32.5% per year and profits are expected to grow 12.01% annually.
See what the numbers say about this price — find out in our valuation breakdown.
Result: Price-to-earnings of 21.3x (UNDERVALUED)
Still, the large US$1.13b shelf and recent share price weakness leave Hornbeck Offshore Services exposed if investor appetite for new equity or sector sentiment cools further.
Find out about the key risks to this Hornbeck Offshore Services narrative.
Another View on Hornbeck Offshore Services Valuation
The P/E comparison presents Hornbeck Offshore Services as inexpensive relative to peers, yet the SWS DCF model indicates a different perspective. Based on those cash flow assumptions, the estimated value is $33.07 per share versus the current $8.58 price, which suggests a much deeper undervaluation.
When one framework points to a mild discount and another implies a large gap, the key question is which set of inputs you place more weight on: the recent earnings snapshot or the long term cash flow profile.
Look into how the SWS DCF model arrives at its fair value.
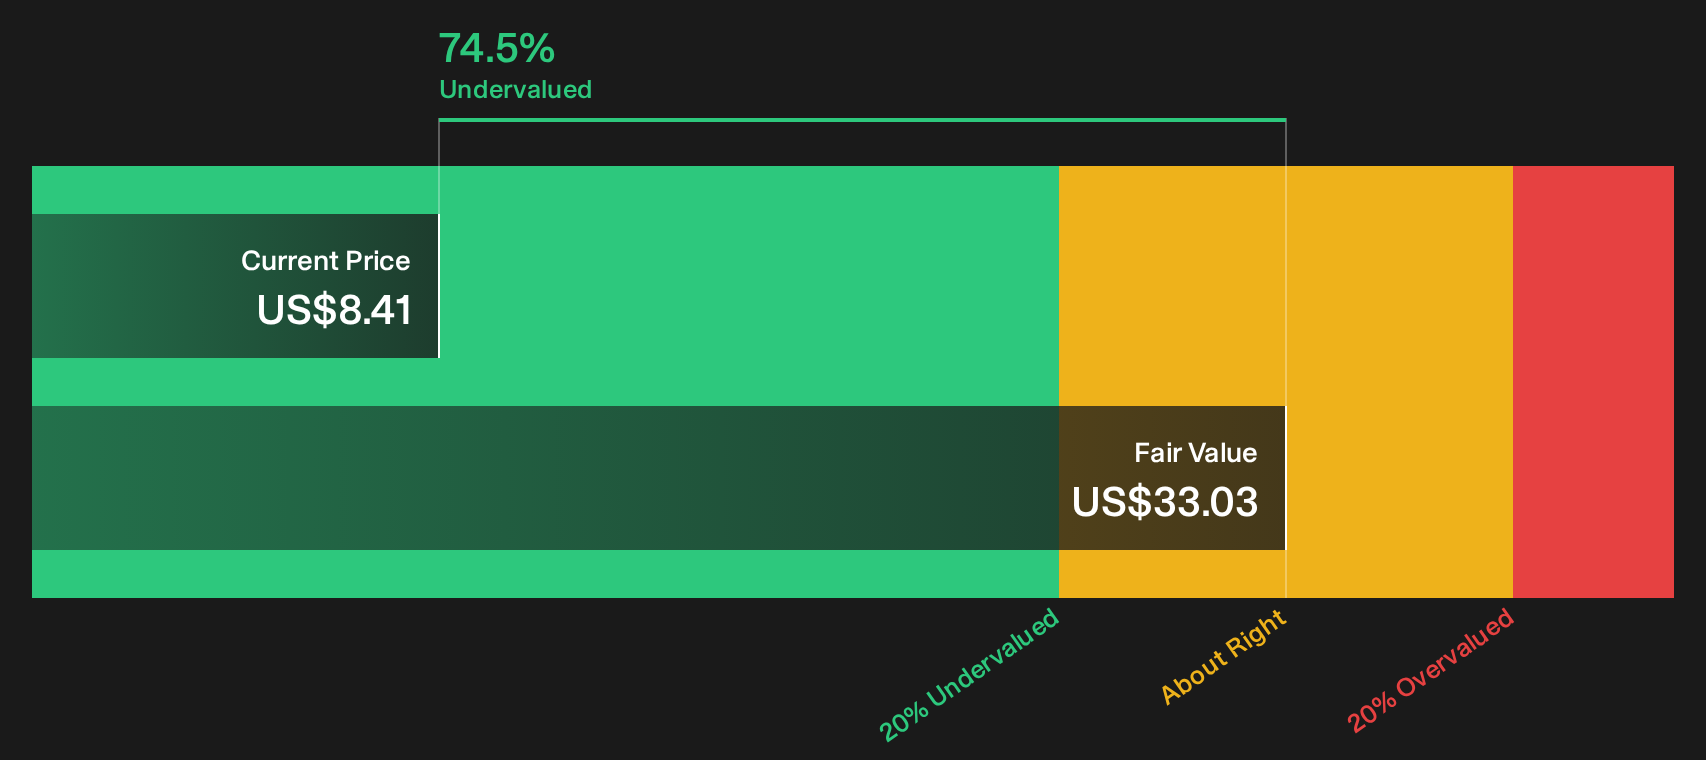
Simply Wall St performs a discounted cash flow (DCF) on every stock in the world every day (check out Hornbeck Offshore Services for example). We show the entire calculation in full. You can track the result in your watchlist or portfolio and be alerted when this changes, or use our stock screener to discover 29 high quality undervalued stocks. If you save a screener we even alert you when new companies match - so you never miss a potential opportunity.
Next Steps
There are mixed signals on Hornbeck Offshore Services so far. If you want to move past the headline numbers and form your own view quickly, start by weighing the company’s 3 key rewards and 2 important warning signs.
Looking for more investment ideas beyond Hornbeck Offshore Services?
If Hornbeck Offshore Services has your attention, do not stop there. A few minutes with a focused screener can completely change your opportunity set.
- Target undervalued quality by scanning companies that screen well on both fundamentals and valuation signals through a curated 29 high quality undervalued stocks.
- Anchor your portfolio with income ideas by zeroing in on dependable payers using our hand picked 6 dividend fortresses.
- Limit downside risk by concentrating on companies with strong finances and steady profiles through a carefully filtered 30 resilient stocks with low risk scores.
This article by Simply Wall St is general in nature. We provide commentary based on historical data and analyst forecasts only using an unbiased methodology and our articles are not intended to be financial advice. It does not constitute a recommendation to buy or sell any stock, and does not take account of your objectives, or your financial situation. We aim to bring you long-term focused analysis driven by fundamental data. Note that our analysis may not factor in the latest price-sensitive company announcements or qualitative material. Simply Wall St has no position in any stocks mentioned.
Have feedback on this article? Concerned about the content? Get in touch with us directly. Alternatively, email editorial-team@simplywallst.com