


MISUMI Group (TSE:9962) Expands In The Americas, Is The Stock Fully Priced?
MISUMI Group (TSE:9962) just put a clear marker down in the Americas by backing a new US$50 million venture fund and creating KIBAN, LLC to build a North American manufacturing platform for frontier technologies.
These moves come at a time when MISUMI Group’s 1-year total shareholder return of 56.05% and 3-year total shareholder return of 61.53% have already rewarded patient holders. Meanwhile, the 1-day share price return of 1.91% and 7-day share price return of 5.31% suggest fresh momentum is building around the stock following the Americas push.
Scan other potential beneficiaries of the same robotics and industrial AI trend that MISUMI Group is leaning into by reviewing our curated list of 95 robotics and automation stocks.
MISUMI Group is suddenly priced for a bigger future in robotics and industrial AI, yet the Americas build out is only just starting to take shape. Do you lean in now, or wait for a cheaper entry before the numbers catch up?
Preferred P/E of 21.3x for MISUMI Group: Is it justified?
MISUMI Group is being valued on a P/E of 21.3x against a last close of ¥3,630, which places the shares at a richer earnings multiple than both its Machinery peers and the wider Japanese market.
The P/E ratio compares the share price to earnings per share. For a business like MISUMI Group that sells standardized factory automation and die components across multiple regions, this metric is a quick way to see how much investors are willing to pay today for each unit of current profit.
Earnings grew 30.2% over the past year and are forecast to rise 12.4% per year, with revenue expected to grow 9.3% per year, which helps explain why the market is comfortable assigning a premium to MISUMI Group compared with the Machinery industry average P/E of 13.4x and the peer average of 18.2x. That said, the stock is only slightly above the estimated fair P/E of 21x, which suggests the current pricing already reflects a significant portion of these expectations and may limit the potential for further multiple expansion if results moderate.
Explore the SWS fair ratio for MISUMI Group.
Result: Price-to-earnings of 21.3x (OVERVALUED).
Still, MISUMI Group’s richer P/E leaves little room for disappointment if automation demand softens or the Americas build out drags on near term returns.
Find out about the key risks to this MISUMI Group narrative.
Another View on MISUMI Group's Value
The P/E of 21.3x paints MISUMI Group as expensive next to Machinery peers, yet the SWS DCF model points the other way. On that approach, the shares at ¥3,630 sit below an estimated future cash flow value of ¥6,390.14. Which signal do you trust when the story diverges this much?
Look into how the SWS DCF model arrives at its fair value.
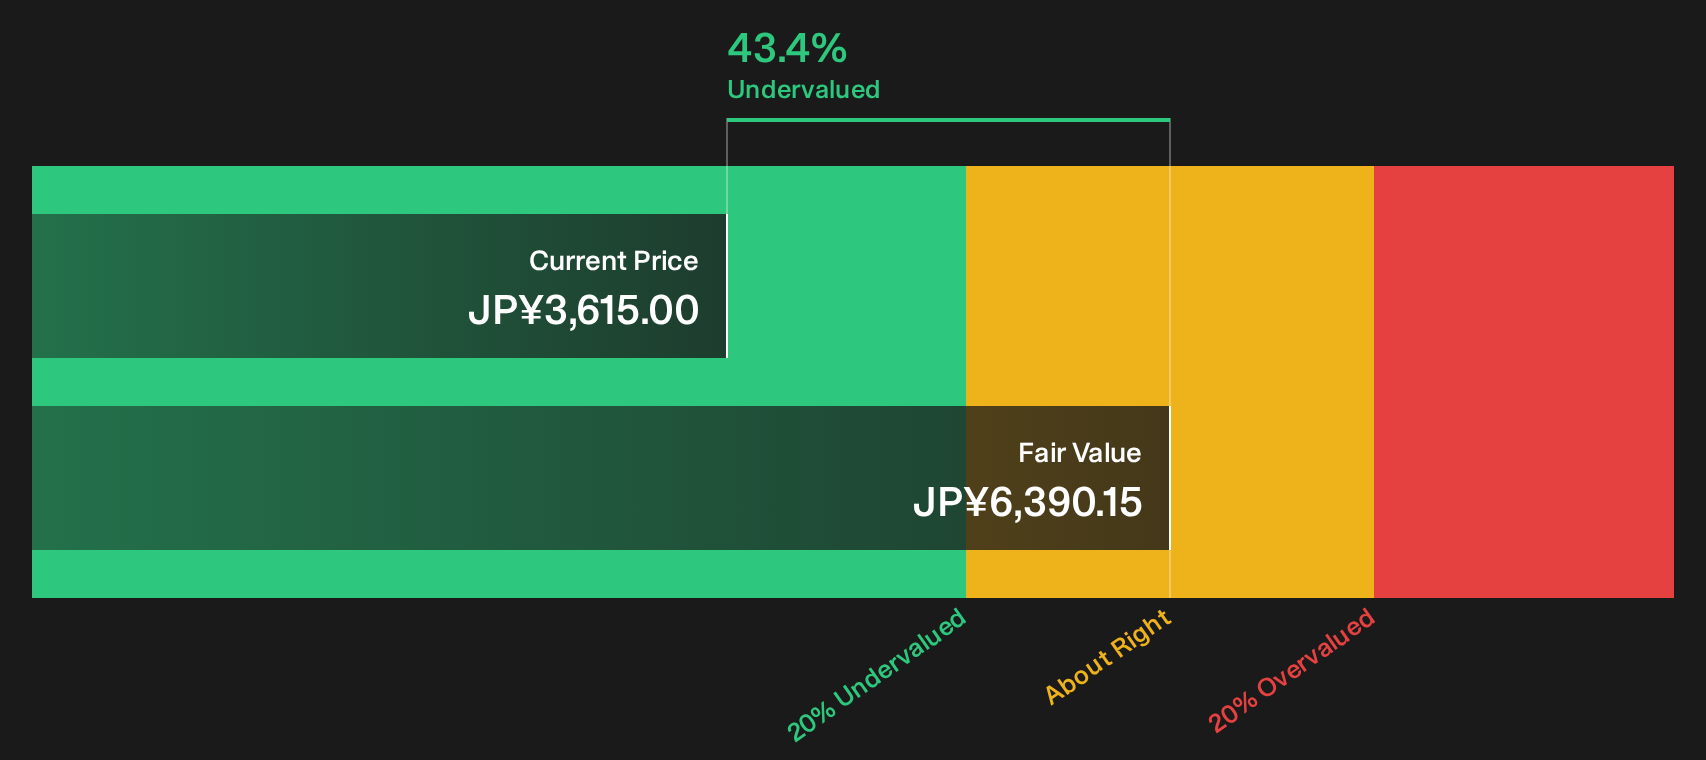
Simply Wall St performs a discounted cash flow (DCF) on every stock in the world every day (check out MISUMI Group for example). We show the entire calculation in full. You can track the result in your watchlist or portfolio and be alerted when this changes, or use our stock screener to discover 17 high quality undervalued stocks. If you save a screener we even alert you when new companies match - so you never miss a potential opportunity.
Next Steps
Mixed signals around MISUMI Group can feel exciting and uncomfortable at the same time, so review the data promptly, test your assumptions, and weigh both sides of the story with the 3 key rewards and 1 important warning sign
Hunting for more ideas beyond MISUMI Group?
Do not stop your research with MISUMI Group when you can quickly scan other stocks that might fit your risk, income, or quality checklist using the Simply Wall Street screener.
- Target resilient balance sheets and steady fundamentals by running a focused search through our list of solid balance sheet and fundamentals (20 results).
- Pursue potential bargains with quality backing them by checking companies filtered as 17 high quality undervalued stocks.
- Lock in income focused ideas and see which businesses show up as 14 dividend fortresses.
This article by Simply Wall St is general in nature. We provide commentary based on historical data and analyst forecasts only using an unbiased methodology and our articles are not intended to be financial advice. It does not constitute a recommendation to buy or sell any stock, and does not take account of your objectives, or your financial situation. We aim to bring you long-term focused analysis driven by fundamental data. Note that our analysis may not factor in the latest price-sensitive company announcements or qualitative material. Simply Wall St has no position in any stocks mentioned.
Have feedback on this article? Concerned about the content? Get in touch with us directly. Alternatively, email editorial-team@simplywallst.com