


GBPUSD Flashback: A clear Elliott wave pattern that called more weakness
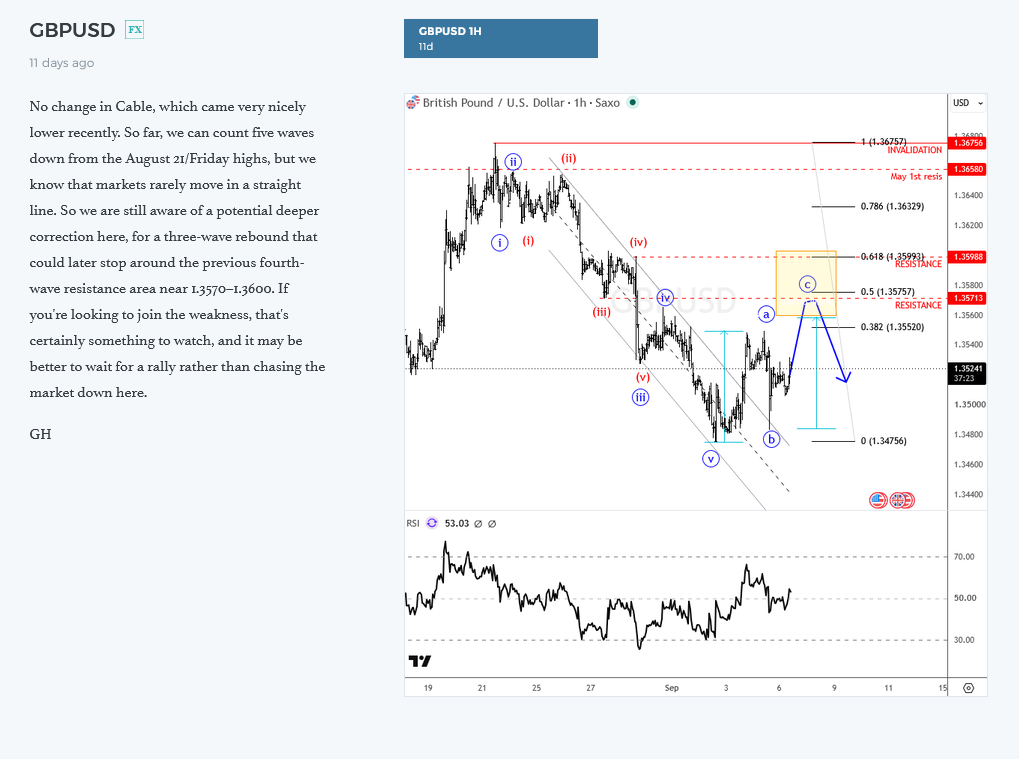
Around September 7, GBPUSD had completed five waves down from the August 21 high. The decline was already extended, so the plan was not to chase it. A three-wave rebound into 1.3570-1.3600 offered a cleaner short area.
Original map - September 7, 2026
The chart showed five waves lower and a projected rebound into prior fourth-wave resistance.
Yellow-box explanation
The yellow zone marked confluence between Elliott Wave projections, Fibonacci levels and prior market structure. It identified where risk-to-reward could become attractive and helped define a reversal plan with invalidation. It was not an automatic entry signal.
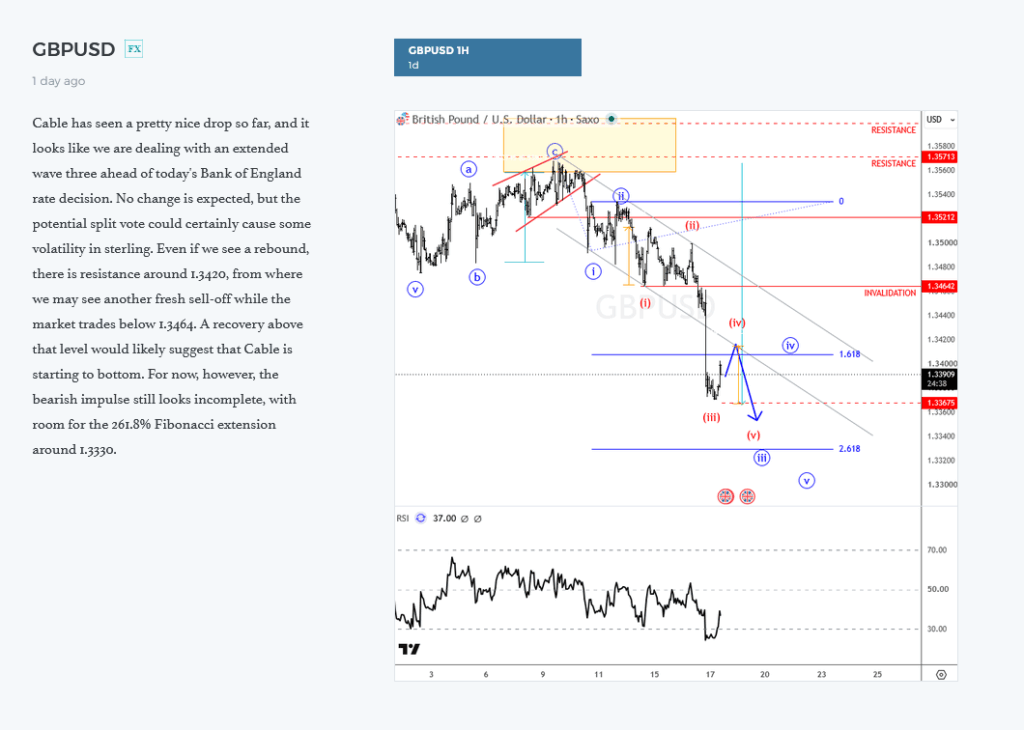
Update - September 17, 2026
The rebound followed the map. Shorts were activated as price pressed into an extended wave three ahead of the Bank of England event. Resistance was near 1.3420; a sustained move below 1.3464 kept the bearish impulse in focus, with room toward the 261.8% extension near 1.3330.
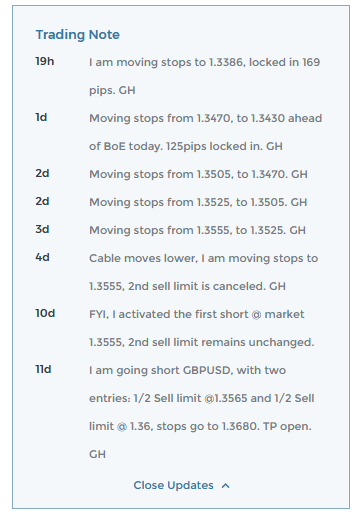
Trading notes timeline
11d: two sell limits at 1.3565 and 1.3600, stops at 1.3680. 10d: first short activated at 1.3555. 4d: stop moved to 1.3555 and second limit canceled. 3d: stop to 1.3525. 2d: stop to 1.3505, then 1.3470. 1d: stop to 1.3430 ahead of the BoE decision. 19h: stop to 1.3386, locking in 169 pips.
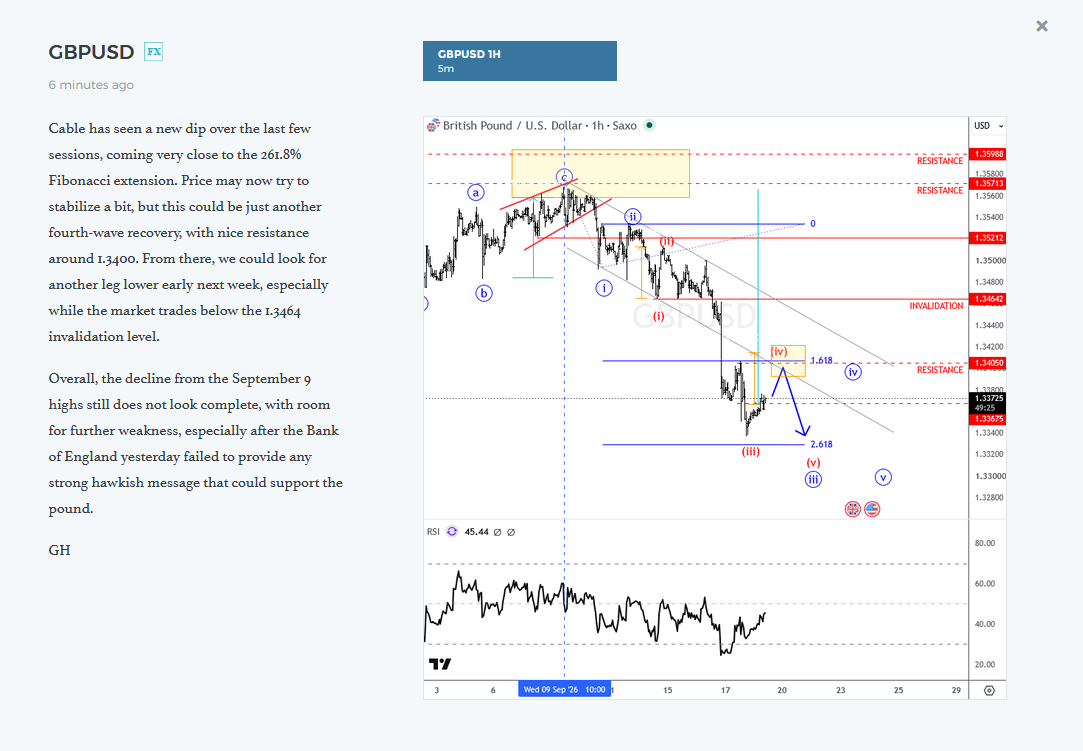
Slide 4 - September 18, 2026
A later chart showed a possible fourth-wave recovery near 1.3400, while further weakness remained favored below the 1.3464 invalidation level.
The key was the clear Elliott wave pattern: five waves down, three waves up. This is educational market commentary, not investment advice, and trading involves substantial risk.
To follow similar analysis and updates, apply for a free 7-day trial.