


Asian Stocks Trading Below Estimated Value In September 2026
In September 2026, Asian markets have been navigating a complex landscape marked by geopolitical tensions and fluctuating oil prices, which have influenced investor sentiment across the region. Amid these challenges, identifying stocks that are trading below their estimated value can offer potential opportunities for investors seeking to capitalize on market inefficiencies.
Top 10 Undervalued Stocks Based On Cash Flows In Asia
| Name | Current Price | Fair Value (Est) | Discount (Est) |
| Shizuki Electric (TSE:6994) | ¥1174.00 | ¥2297.68 | 48.9% |
| Rakus (TSE:3923) | ¥1089.00 | ¥2073.55 | 47.5% |
| P.S.P. Specialties (SET:PSP) | THB7.80 | THB14.87 | 47.6% |
| PAL GROUP Holdings (TSE:2726) | ¥1492.00 | ¥2880.99 | 48.2% |
| Niterra (TSE:5334) | ¥7218.00 | ¥13813.30 | 47.7% |
| Dongwon Industries (KOSE:A006040) | ₩36200.00 | ₩70862.72 | 48.9% |
| Cosmo Energy Holdings (TSE:5021) | ¥4624.00 | ¥9244.36 | 50% |
| Cheil Worldwide (KOSE:A030000) | ₩17380.00 | ₩34111.58 | 49% |
| BuySell TechnologiesLtd (TSE:7685) | ¥2914.00 | ¥5591.83 | 47.9% |
| AK Medical Holdings (SEHK:1789) | HK$4.84 | HK$9.58 | 49.5% |
Let's dive into some prime choices out of the screener.
Kumagai GumiLtd (TSE:1861)
Overview: Kumagai Gumi Co., Ltd. is a construction company operating both in Japan and internationally, with a market capitalization of approximately ¥225 billion.
Operations: The company's revenue primarily comes from Building Construction at ¥252.69 billion, followed by Civil Engineering at ¥116.10 billion, and its Subsidiaries contributing ¥125.47 million.
Estimated Discount To Fair Value: 45.7%
Kumagai Gumi Ltd. is trading significantly below its estimated future cash flow value, with a current price of ¥1,324 compared to a DCF valuation of ¥2,439.26. Despite slower revenue growth forecasts at 2.8% annually compared to the market's 6.4%, earnings are expected to grow faster than the market at 10.4% per year. Recent results show improved net income and EPS year-over-year, supporting its undervaluation narrative based on cash flows.
- Our earnings growth report unveils the potential for significant increases in Kumagai GumiLtd's future results.
- Dive into the specifics of Kumagai GumiLtd here with our thorough financial health report.

Rinnai (TSE:5947)
Overview: Rinnai Corporation manufactures and sells thermal equipment across Japan, the United States, Australia, China, South Korea, and Indonesia with a market cap of ¥483.24 billion.
Operations: The company's revenue segments are ¥253.66 billion from Japan, ¥73.58 billion from the United States, ¥61.78 billion from China, ¥47.62 billion from Australia, ¥35.37 billion from South Korea, and ¥19.11 billion from Indonesia.
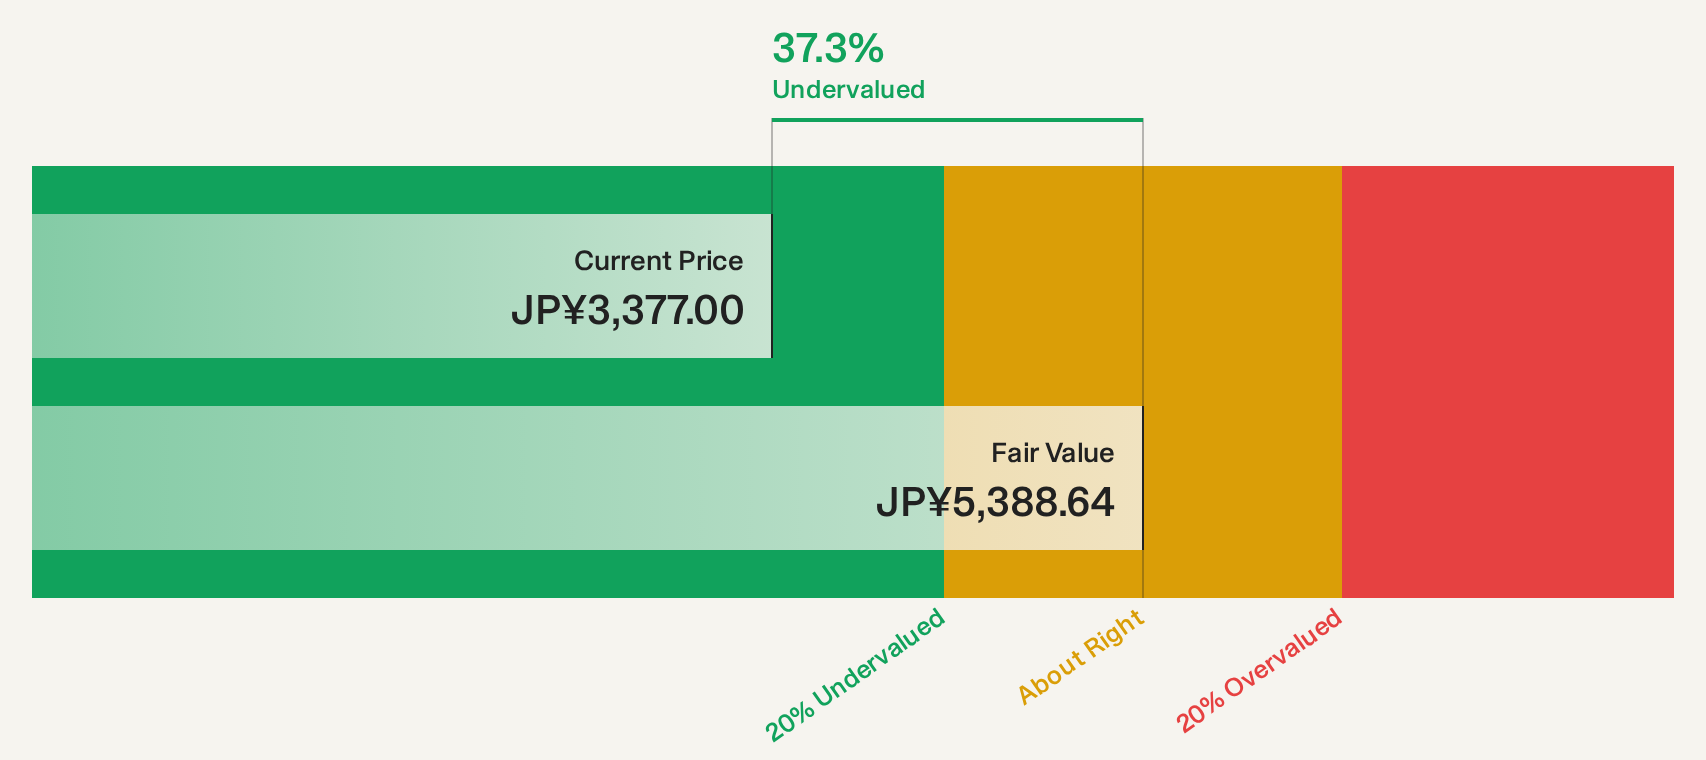
Estimated Discount To Fair Value: 34.9%
Rinnai is currently trading below its estimated future cash flow value, with a share price of ¥3,500 against a DCF valuation of ¥5,377.21. Despite earnings growth forecasts of 2.58% annually—slower than the market's 8.8%—recent quarterly results show increased sales and net income year-over-year. Analysts agree on a potential stock price increase by 24.5%, highlighting its undervaluation based on cash flows despite modest revenue growth expectations at 3.6% per year.
- According our earnings growth report, there's an indication that Rinnai might be ready to expand.
- Delve into the full analysis health report here for a deeper understanding of Rinnai.
WT Microelectronics (TWSE:3036)
Overview: WT Microelectronics Co., Ltd. and its subsidiaries offer electronic component distribution services across the United States, Taiwan, Mainland China, and other international markets, with a market cap of NT$259.20 billion.
Operations: The company generates revenue primarily from its electronics wholesale segment, amounting to NT$1.76 billion.
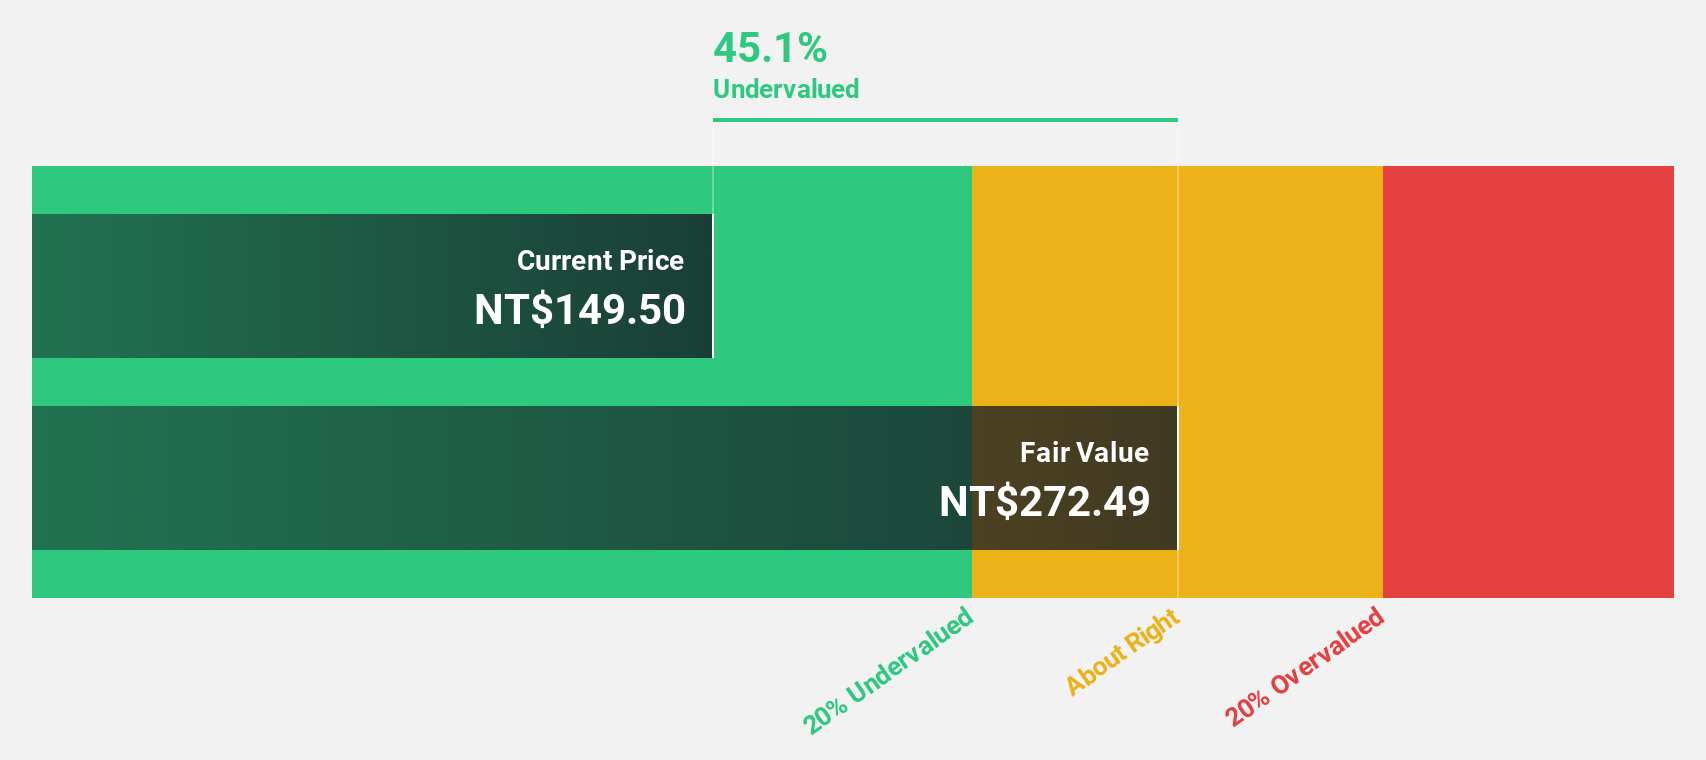
Estimated Discount To Fair Value: 10.5%
WT Microelectronics is trading below its estimated future cash flow value, with a share price of NT$204 compared to a DCF valuation of NT$227.88. Recent earnings show significant growth, with net income for the second quarter at TWD 9.71 billion, up from TWD 2.83 billion year-over-year. Analysts forecast annual revenue and earnings growth rates of 29.6% and 28%, respectively, outpacing the Taiwan market averages, indicating potential undervaluation based on cash flows despite an unstable dividend history.
- The analysis detailed in our WT Microelectronics growth report hints at robust future financial performance.
- Click here and access our complete balance sheet health report to understand the dynamics of WT Microelectronics.
Where To Now?
- Take a closer look at our Undervalued Asian Stocks Based On Cash Flows list of 80 companies by clicking here.
- Invested in any of these stocks? Simplify your portfolio management with Simply Wall St and stay ahead with our alerts for any critical updates on your stocks.
- Maximize your investment potential with Simply Wall St, the comprehensive app that offers global market insights for free.
Seeking Other Investments?
- Explore high-performing small cap companies that haven't yet garnered significant analyst attention.
- Diversify your portfolio with solid dividend payers offering reliable income streams to weather potential market turbulence.
- Fuel your portfolio with companies showing strong growth potential, backed by optimistic outlooks both from analysts and management.
This article by Simply Wall St is general in nature. We provide commentary based on historical data and analyst forecasts only using an unbiased methodology and our articles are not intended to be financial advice. It does not constitute a recommendation to buy or sell any stock, and does not take account of your objectives, or your financial situation. We aim to bring you long-term focused analysis driven by fundamental data. Note that our analysis may not factor in the latest price-sensitive company announcements or qualitative material. Simply Wall St has no position in any stocks mentioned.
Have feedback on this article? Concerned about the content? Get in touch with us directly. Alternatively, email editorial-team@simplywallst.com