


Best Buy (BBY), What Is Drawing Fresh Attention Now?
Best Buy (BBY) has drawn fresh attention after its shares closed at US$92.45, with recent returns over the past month and past 3 months prompting investors to reassess expectations and risk.
Recent trading has come with a mixed tone, with Best Buy’s share price slipping 0.9% on the day while still posting a 5.0% 7 day gain, an 8.2% 30 day share price return, a 33.6% year to date rise, and a 32.4% 1 year total shareholder return. This performance points to momentum building over both shorter and longer periods.
Scan how Best Buy’s recent momentum compares with other retailers by checking which stocks are powering similar moves in the 33 high quality undervalued stocks.
Best Buy looks like a solid tech retailer with US$42.2b in revenue and US$1.3b in net income, yet the share price surge raises a simple issue: Are you paying a fair valuation for that strength today?
Most Popular Narrative: 6.6% Overvalued
On the most followed view of Best Buy, the narrative fair value of $86.70 sits below the last close at $92.45. This frames the recent share price strength as running a little ahead of that model.
Launch and scaling of Best Buy's online marketplace add significant product assortment (6x prior levels), improve customer digital experience, and broaden participation in profitable retail media (ad) revenue streams, driving top-line growth and contributing to improved operating margin over time even with initial investment costs.
See why 62 investors see Best Buy as 7% overvalued.
Result: Fair Value of $86.70 (OVERVALUED)
Still, the Best Buy story can break if lower margin categories continue to drag on profitability or if rising online competition steadily chips away at store traffic.
Find out about the key risks to this Best Buy narrative.
Another Take On Best Buy’s Valuation
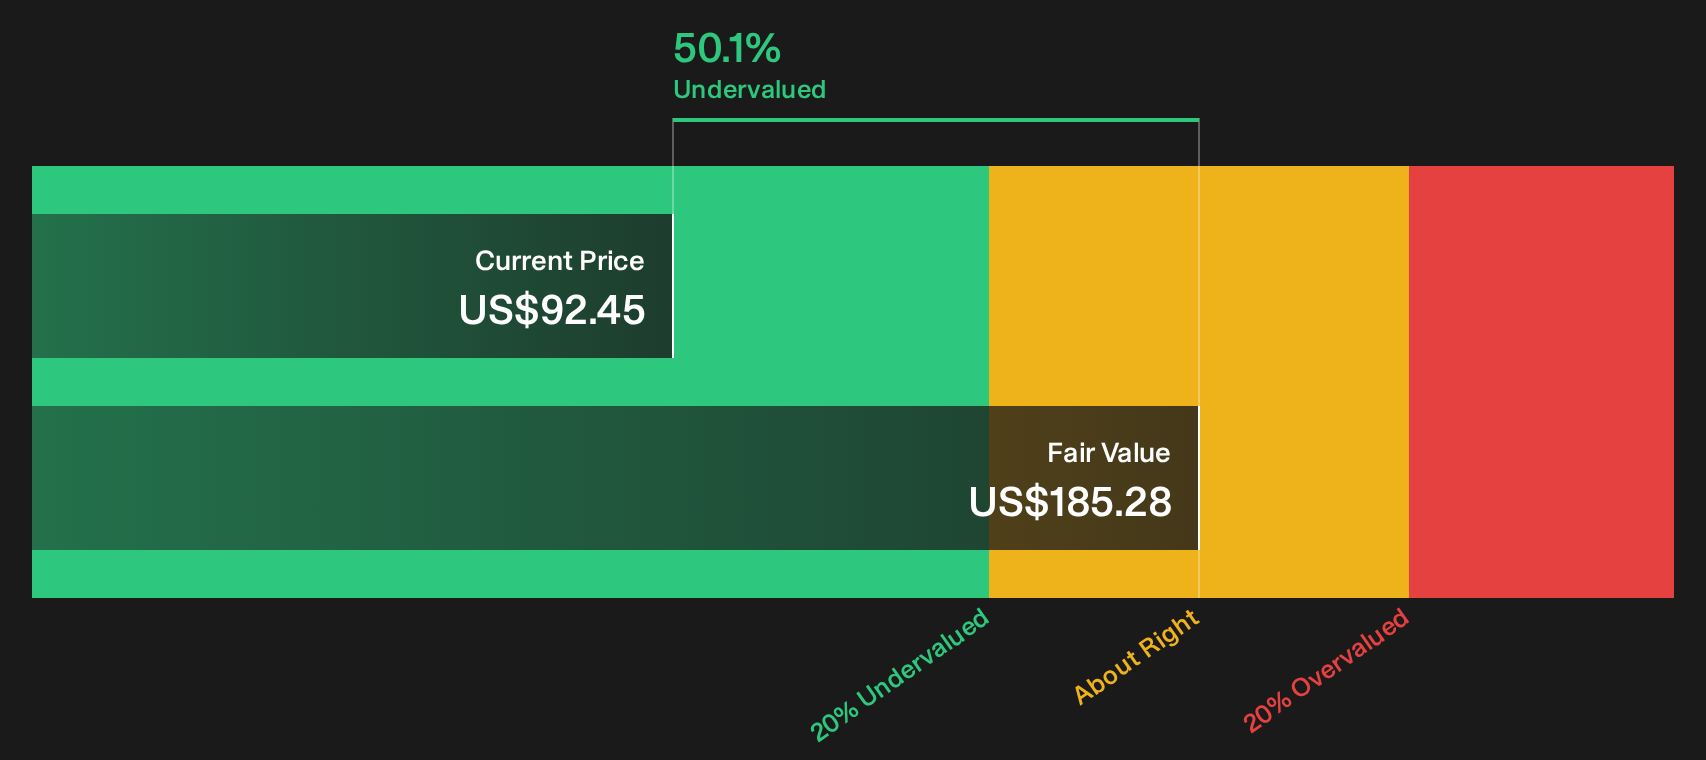
The first view paints Best Buy as 6.6% overvalued against a narrative fair value of $86.70, yet the SWS DCF model points in the opposite direction. On that cash flow lens, BBY at $92.45 trades about 50% below an estimated value of $185.28. Which story do you trust more: the near term narrative or the long term cash flows?
To see how that cash flow view is built and stress test the assumptions against your own expectations, walk through the Look into how the SWS DCF model arrives at its fair value..
Next Steps
Mixed signals on Best Buy’s value story can feel anything but simple, so move fast, review the data for yourself, and weigh both the optimism and the caution by digging into the 4 key rewards and 1 important warning sign.
Looking for more Best Buy sized ideas?
Do not stop at Best Buy. Use the Simply Wall St screener to spot fresh setups and keep your watchlist packed with opportunities before others notice.
- Target reliable income streams by scanning dividend payers that aim for resilience in both payouts and financial strength through the 6 dividend fortresses.
- Hunt for mispriced opportunities by sorting financially solid businesses that trade below their estimated value using the 33 high quality undervalued stocks.
- Prioritise peace of mind by focusing on companies with stronger balance sheets and steadier fundamentals through the list of solid balance sheet and fundamentals (22 results).
This article by Simply Wall St is general in nature. We provide commentary based on historical data and analyst forecasts only using an unbiased methodology and our articles are not intended to be financial advice. It does not constitute a recommendation to buy or sell any stock, and does not take account of your objectives, or your financial situation. We aim to bring you long-term focused analysis driven by fundamental data. Note that our analysis may not factor in the latest price-sensitive company announcements or qualitative material. Simply Wall St has no position in any stocks mentioned.
Have feedback on this article? Concerned about the content? Get in touch with us directly. Alternatively, email editorial-team@simplywallst.com