


3 Industrial Stocks Tied To EU Canada Supply Chains Investors Should Watch
Trade friction with the U.S. is rising while Brussels and Ottawa flirt with a deeper economic security pact. That mix could quietly reshuffle where capital and supply chains flow next. Investors who wait for the dust to settle often miss the early pricing of those shifts. This article walks through three stocks from our EU–Canada Economic Security and Supply-Chain Resilience Winners screener that appear closely tied to this story.
The three examples below are only a starter pack, since the full screen surfaced 55 more EU and Canadian companies with equally compelling supply-chain, defense, AI, and semiconductor narratives that are not covered here. To identify and analyze the highest conviction angles in this theme directly, head straight into the EU–Canada Economic Security and Supply-Chain Resilience Winners screener.
CSG (ENXTAM:CSG)
Overview: CSG is a Prague based defence group that supplies ammunition, vehicles, radars, and aerospace systems to NATO aligned customers worldwide.
Operations: CSG generates about €1.31b from its Ammo+ division, with a large additional segment adjustment of roughly €5.97b.
Market Cap: €15.79b
CSG gives this EU–Canada economic security theme a concrete anchor, because its artillery shells, armoured vehicles, and radar systems sit directly in the supply chains allies are trying to harden.
"If the war in Ukraine ends, arms manufacturers' shares would plummet by tens of percent, and CSG would be more affected than Rheinmetall, which supplies the German army on a large scale; this is the risk."
What really matters for CSG now is how one unresolved policy decision shapes long term demand visibility across allied procurement plans.
That long term question on demand is exactly what the full narrative for CSG unpacks, including how shifting EU and Canada priorities could either accelerate or cap the next phase of CSG.

Theon International (ENXTAM:THEON)
Overview: Theon International develops night vision, thermal imaging, and ISR devices that help allied militaries and security forces operate with shared, resilient equipment.
Operations: Theon International generates about €508 million in revenue from its Optronics segment, which covers its optical and electro-optical product range.
Market Cap: €2.39 billion
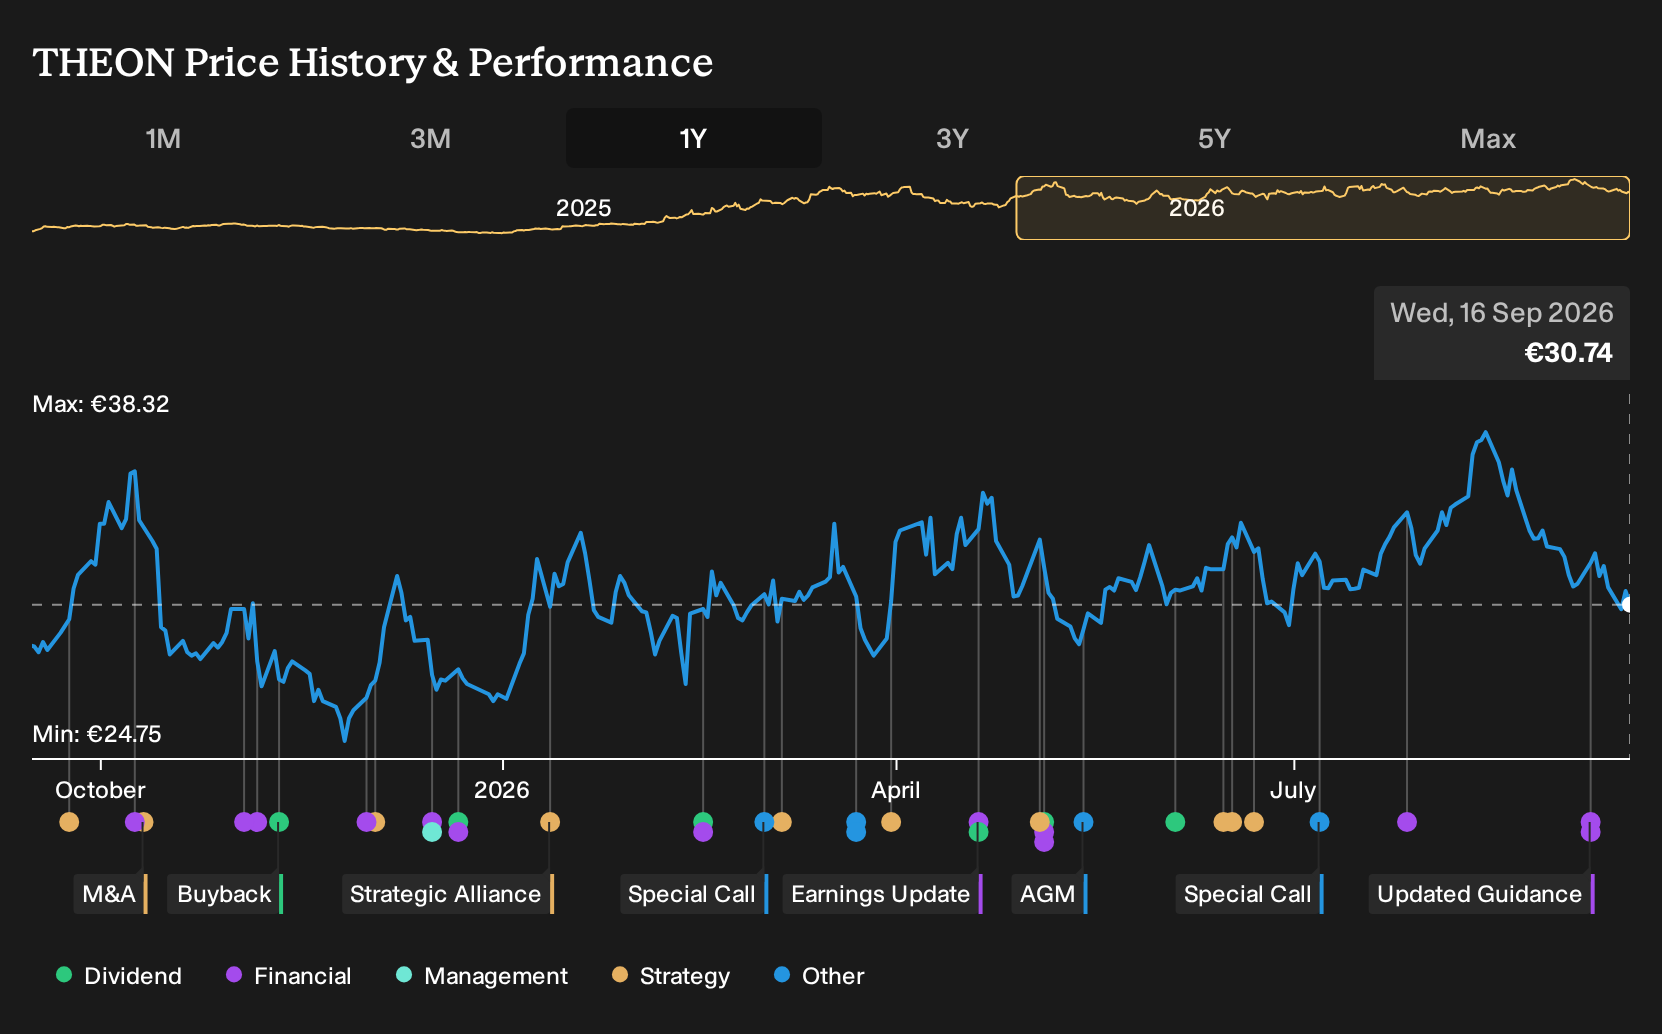
Theon International plugs directly into the EU–Canada economic security theme because its night vision and ISR gear is designed to support interoperability among allied forces and keep supply chains in friendly hands. Record revenue, a €1.46b backlog and strong margins give the story real weight, with the outlook influenced by how defense budgets and cross-border programs evolve over time.
Those cross border programs are exactly where the analysis report for Theon International can help you identify what current orders might be masking about future defence exposure and contract momentum.
Firan Technology Group (TSX:FTG)
Overview: Firan Technology Group produces avionics circuit boards and cockpit electronics for aerospace and defense customers across North America, Europe, and Asia.
Operations: FTG generates about CA$128 million from its Circuits segment and CA$75 million from Aerospace, with most revenue coming from the United States.
Market Cap: CA$534 million
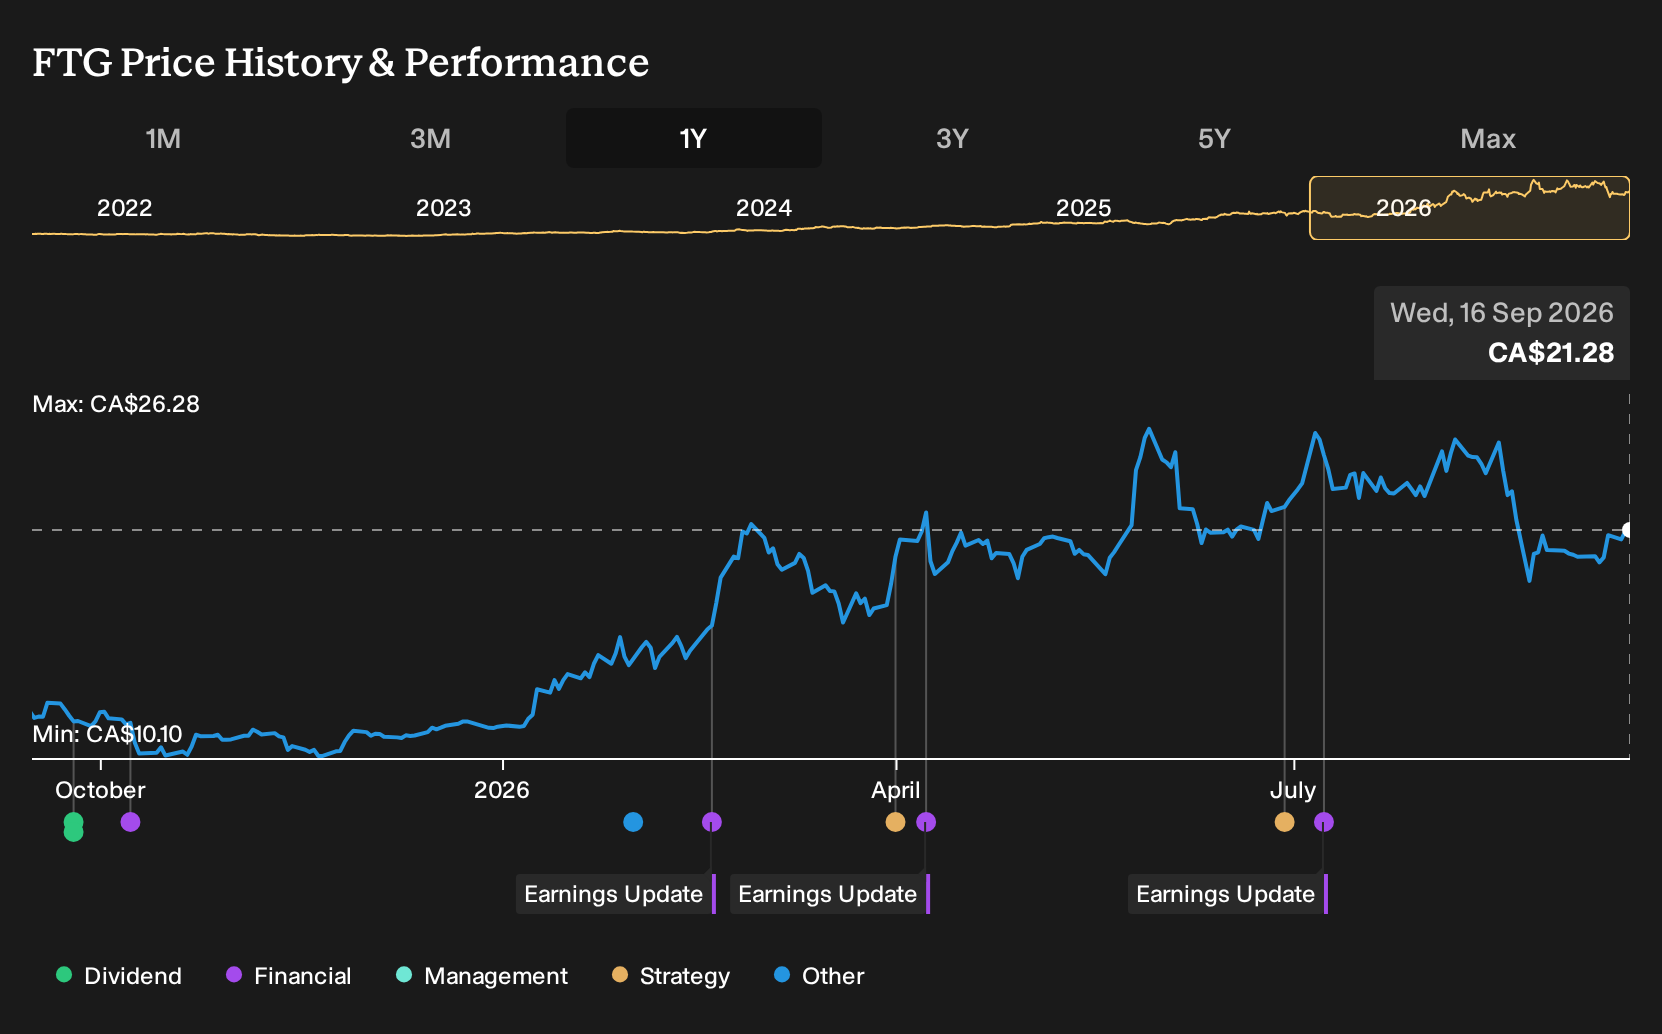
Firan Technology Group fits this EU–Canada economic security story because its cockpit electronics and avionics hardware help reduce reliance on single country suppliers for mission critical aerospace systems.
"The acquisition of FLYHT is anticipated to add a new growth lever for FTG, increasing aftermarket penetration (which typically yields higher margins) and expanding FTG's presence with Airbus."
What happens to FTG's margins and bargaining power depends on how one emerging shift in cross border aerospace demand actually plays out.
That inflection point is exactly what the full narrative for Firan Technology Group unpacks, separating one-off acquisition buzz from any deeper shift in FTG's earning power and bargaining clout.
Curious About What You’re Missing?
Fresh themes move fast. By the time a breakout story hits headlines, early momentum can be gone or prices already flying. Scan these under the radar ideas now and get in early.
- Spot income workhorses before yields get compressed by late buyers using the curated 162 dividend fortresses, built to highlight resilience while it still matters.
- Track capital racing into real-world AI infrastructure with the focused 60 AI infrastructure stocks, so you are not caught chasing momentum after the crowd moves in.
- Target operationally solid operators before the spotlight widens by running the list of solid balance sheet and fundamentals (194 results), while these balance sheet standouts are still priced like afterthoughts.
This article by Simply Wall St is general in nature. We provide commentary based on historical data and analyst forecasts only using an unbiased methodology and our articles are not intended to be financial advice. It does not constitute a recommendation to buy or sell any stock, and does not take account of your objectives, or your financial situation. We aim to bring you long-term focused analysis driven by fundamental data. Note that our analysis may not factor in the latest price-sensitive company announcements or qualitative material. Simply Wall St has no position in any stocks mentioned.
Have feedback on this article? Concerned about the content? Get in touch with us directly. Alternatively, email editorial-team@simplywallst.com