


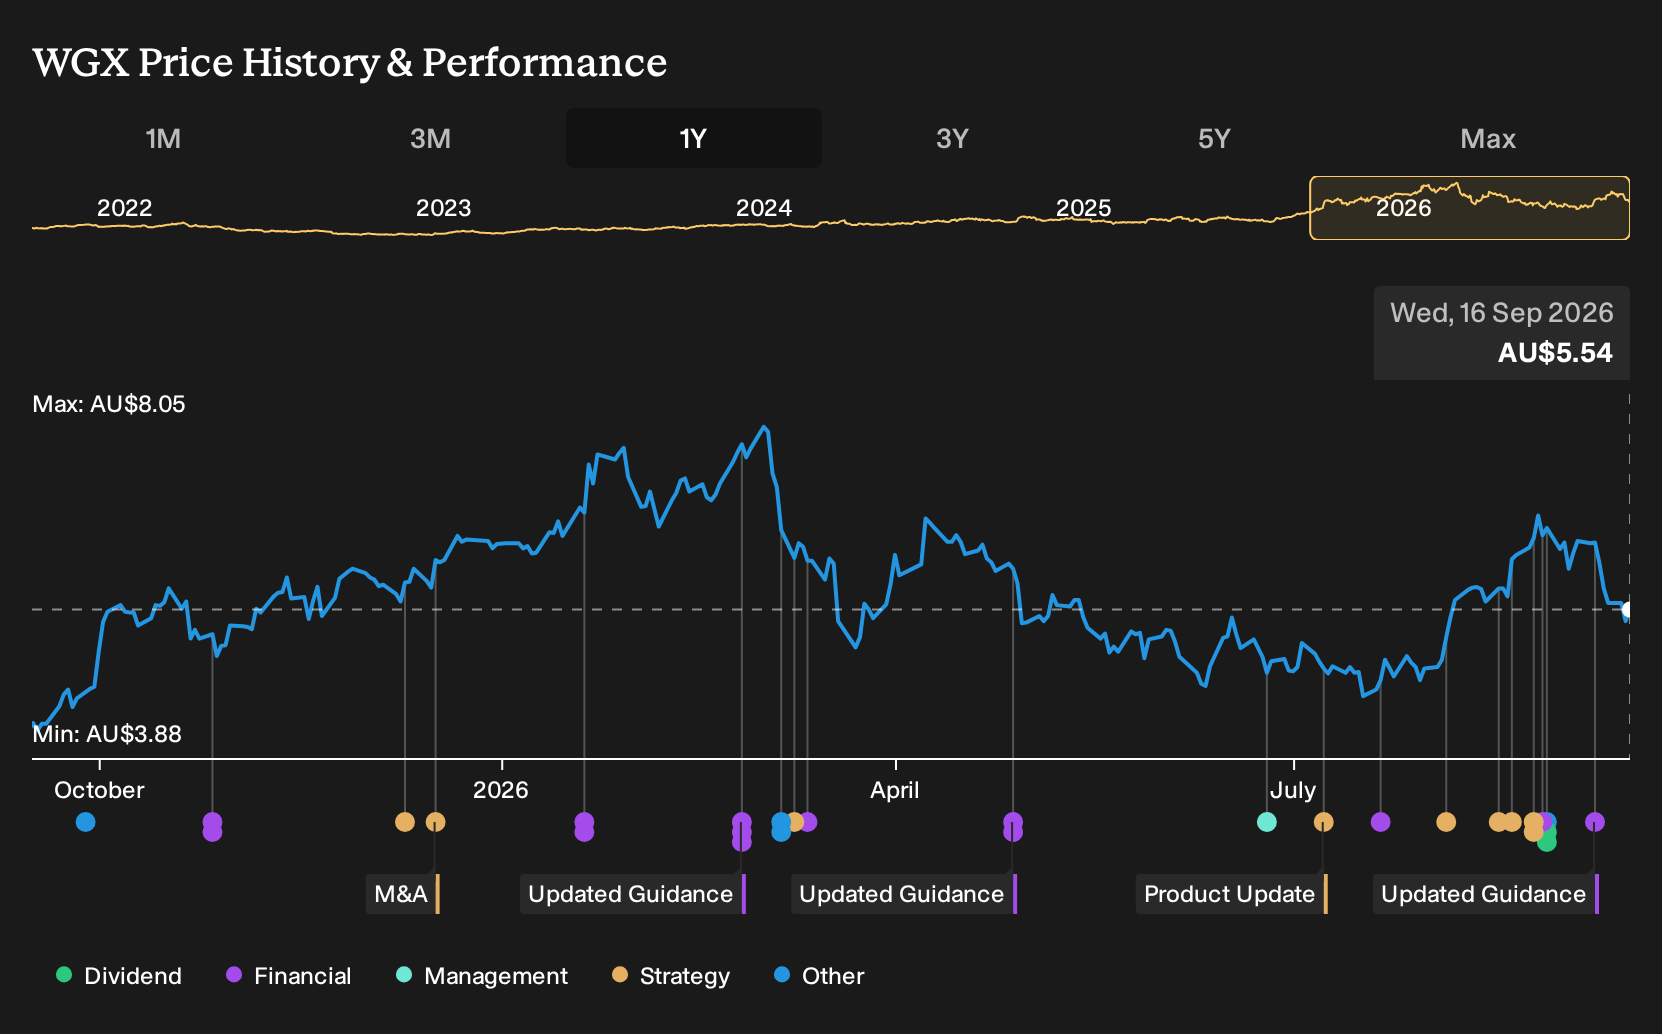
Production Guidance Update Altering The Investment Case For Westgold Resources Shares?
- Westgold Resources has released new multi year production guidance, outlining expected gold output of about 385 koz to 425 koz for FY 2027, 425 koz to 470 koz for FY 2028, and 460 koz to 510 koz for FY 2029.
- This three year production outlook gives investors a clearer view of how Westgold Resources plans to deploy its expanded asset base and manage operating capacity over time.
- We will now look at how Westgold Resources' new multi year production guidance could reshape the broader investment narrative around the business.
Westgold Resources Investment Narrative Recap
To own Westgold Resources, you need to be comfortable with a production led story. The thesis rests on the group running its enlarged Western Australian footprint at a consistent, efficient clip while keeping ore grades and costs under control. The new multi year production guidance mostly reinforces that idea, since it lays out volume expectations but does not address grades, cost inflation, or technology adoption head on.
In the short term, the key swing factor remains how smoothly the integrated operations and ongoing upgrades perform. The biggest risk still sits in execution on infrastructure and the Karora integration, where any slip in productivity or ore quality could pressure margins, regardless of the headline production ranges just outlined.
The 2027 guidance call on 9 September 2026 is the most relevant touchpoint for this production outlook. That forum gives investors a chance to test how management talks about the link between these targets and the heavy capital program at Bluebird South Junction, Beta Hunt, and Higginsville, and to assess whether planned debottlenecking aligns with the guided volumes.
For catalysts, the guidance only really matters if it is backed by credible detail on mine plans, grades, and cost control. The call also sits alongside broader themes for Westgold Resources, including use of its A$614 million liquidity, progress on automation trials, and how quickly exploration success in places like Murchison and the Fletcher Zone can be translated into reserves that support the outer year production bands.
Westgold Resources Analyst Assumptions In Focus
Analysts sketch a fairly ambitious earnings curve for Westgold Resources, built on both volume and margin shifts. Revenue is assumed to rise by 16.1% each year over the next three years, while profit margins are projected to move from 12.8% today to 35.6% by around 2029. On those assumptions, earnings would lift from A$253.0 million at present to about A$1.1b, with no change in the share count and a discount rate of 8.62% used in the modelling. To line up with that profile, the stock would need to trade on a P/E of 7.8x those 2029 earnings, compared with 21.2x today and 12.5x for the wider AU Metals and Mining group.
On these consensus numbers, Westgold Resources is framed as a business that turns production guidance into much higher profitability over time rather than just more tonnes. The sharp jump in earnings assumes that higher throughput, better grades and efficiency gains all come through together across Bluebird South Junction, Beta Hunt and Higginsville. It also implies that execution risk around integration, cost inflation and technology adoption does not erode the margin uplift that analysts have pencilled in. For you as an investor, the key question is whether those margin and volume combinations feel realistic given the operational history and the capital program already under way.
Westgold Resources' narrative projects A$3.1b revenue and A$1.1b earnings by 2029. This rests on 16.1% yearly revenue growth and an earnings increase of about A$847.0 million from A$253.0 million today.
Uncover why Westgold Resources' fair value indicates a 32% potential upside to its current price, a gap that could narrow quickly once expectations reset.
Exploring Other Perspectives
One alternate view on Westgold Resources leans heavily on short reserve life as the key risk. Those analysts were only modelling about 14.2% yearly revenue growth and A$1.2b earnings by 2029, versus A$1.1b in the baseline. That is actually more optimistic on profits, yet still more cautious on how long current ore bodies can support guidance. The new multi year production targets may lead to changes in both perspectives, so it makes sense for you to weigh these different assumptions before deciding which feels closer to your own expectations.
Explore 5 other Westgold Resources fair value estimates, including one that suggests it could be worth just A$7.09!
Reach Your Own Conclusion
Disagree with existing narratives? Extraordinary investment returns rarely come from following the herd, so consider forming your own view.
- A great starting point for your Westgold Resources research is our analysis highlighting 5 key rewards that could impact your investment decision.
- See our latest analysis for Westgold Resources. The report includes a comprehensive fundamental analysis summarized in a single visual, the Snowflake, making it easy to evaluate Westgold Resources' overall financial health at a glance.
Looking For More Ideas Beyond Westgold Resources?
Once you have formed a view on Westgold Resources, it can help to compare it with other opportunities that share similar qualities or offer a very different risk profile. The Simply Wall St Screener is a quick way to filter the market using the same kind of fundamentals discussed here, so you can build a watchlist that actually matches your own preferences.
- If you want companies that already generate solid cash flows and trade below what their fundamentals might justify, scan our 5 high quality undervalued stocks and see which ones warrant a closer look.
- For investors who care more about resilience and capital preservation than chasing every swing, filter the market using our 3 resilient stocks with low risk scores to spot steadier candidates.
- If you prefer to get in early on lesser known opportunities with healthy financial profiles, track potential outliers using the 15 high quality undiscovered gems and see which stories are still under the radar.
This article by Simply Wall St is general in nature. We provide commentary based on historical data and analyst forecasts only using an unbiased methodology and our articles are not intended to be financial advice. It does not constitute a recommendation to buy or sell any stock, and does not take account of your objectives, or your financial situation. We aim to bring you long-term focused analysis driven by fundamental data. Note that our analysis may not factor in the latest price-sensitive company announcements or qualitative material. Simply Wall St has no position in any stocks mentioned.
Have feedback on this article? Concerned about the content? Get in touch with us directly. Alternatively, email editorial-team@simplywallst.com