


Warehouses De Pauw (ENXTBR:WDP) Holds Near Flat, Is It Below Fair Value?
Warehouses De Pauw (ENXTBR:WDP) is back in focus after recent trading left its month return roughly flat and its past 3 months performance down about 4%, inviting a closer look at today’s €20.96 share price.
Over the past year, Warehouses De Pauw has seen its 1 year total shareholder return reach 3.76%, even as the year to date share price return is down 4.9% and the 5 year total shareholder return has declined 36.26%. This points to fading longer term momentum despite some recent resilience.
Spot opportunities with similar risk and return profiles by comparing Warehouses De Pauw to a hand picked 104 resilient stocks with low risk scores in just a few minutes.
So is Warehouses De Pauw’s muted share move a fair mirror of its logistics real estate fundamentals, or mostly a reset in investor mood after years of weaker long term returns that leaves the current valuation out of sync?
Preferred P/E of 12.6x: Is it justified?
On raw valuation terms, Warehouses De Pauw trades on a P/E of 12.6x, which sits above some peers yet below the broader Global Industrial REITs group, and that mix leaves the current €20.96 share price looking a bit caught between value and caution.
The P/E multiple compares what investors pay today for each euro of current earnings. For a logistics real estate specialist like Warehouses De Pauw, this matters because much of the thesis rests on stable rental income and the reliability of those profits over time.
There is a split picture. Against a peer average P/E of 10.2x, WDP looks expensive, and it also trades above an estimated fair P/E of 11.9x that our fair ratio work suggests the market could move toward. At the same time, the P/E of 12.6x sits below the Global Industrial REITs industry average of 15.4x, which points to investors pricing WDP more cautiously than many global logistics landlords despite recent earnings growth and forecasts that point to faster profit expansion than the Belgian market.
Explore the SWS fair ratio for Warehouses De Pauw..
Result: Preferred multiple of Price-to-Earnings of 12.6x (ABOUT RIGHT)
Still, the 5 year total shareholder return decline of 36.26% and a revenue growth rate of 2.18% leave plenty of room for sentiment to sour again.
Find out about the key risks to this Warehouses De Pauw narrative.
Another view on Warehouses De Pauw’s value
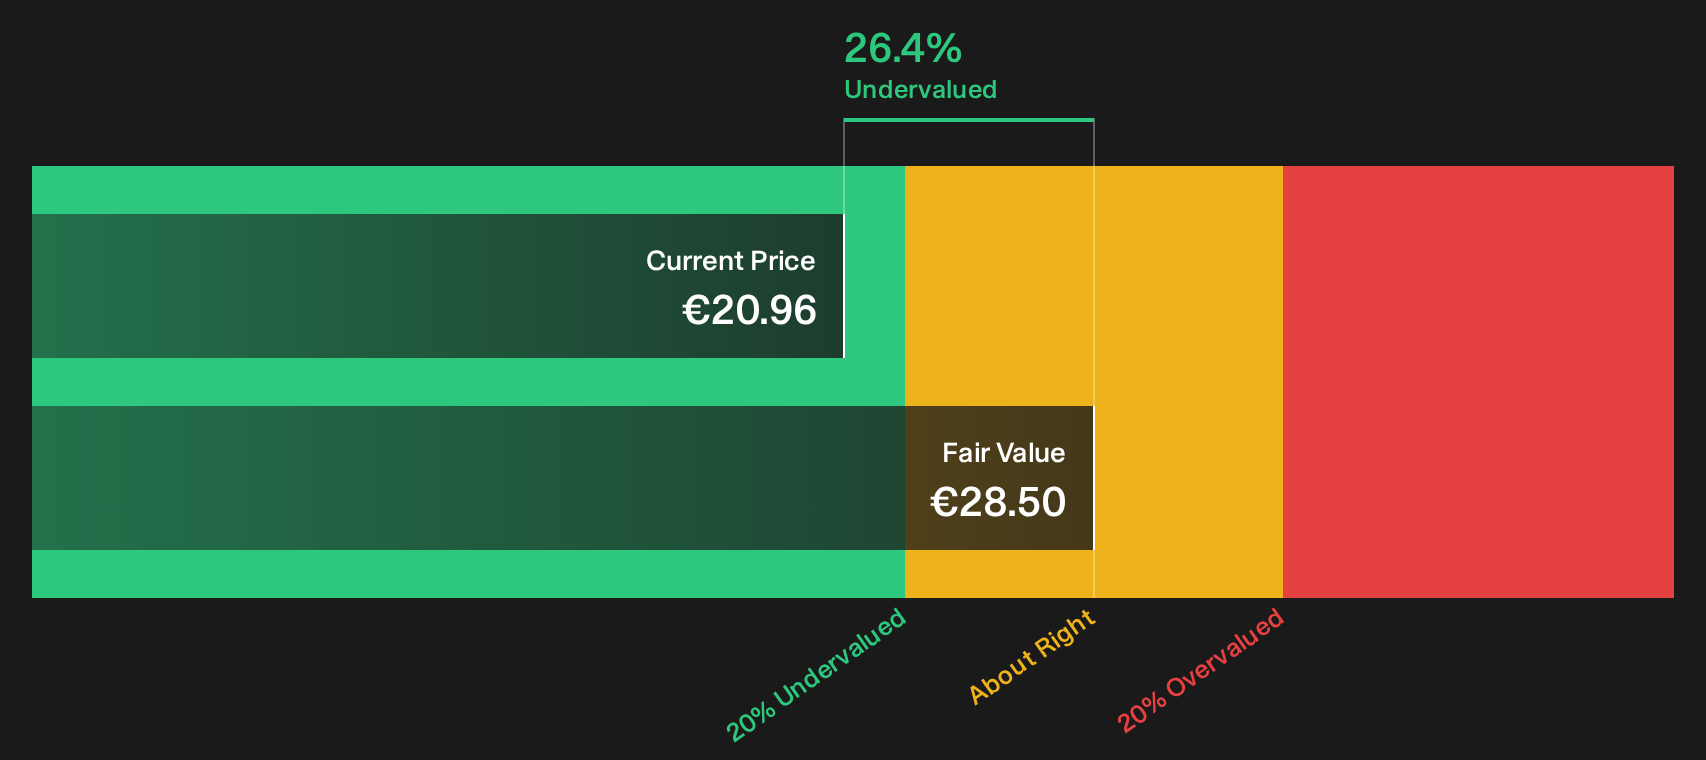
The SWS DCF model tells a different story. On this approach, Warehouses De Pauw at €20.96 is trading below an estimated future cash flow value of €28.50, which suggests the share price may be low relative to long term cash generation. Which lens do you consider more informative when money is on the line?
Look into how the SWS DCF model arrives at its fair value.
Simply Wall St performs a discounted cash flow (DCF) on every stock in the world every day (check out Warehouses De Pauw for example). We show the entire calculation in full. You can track the result in your watchlist or portfolio and be alerted when this changes, or use our stock screener to discover 189 high quality undervalued stocks. If you save a screener we even alert you when new companies match - so you never miss a potential opportunity.
Next Steps
Mixed signals around Warehouses De Pauw’s valuation and sentiment only matter if you use them. Move fast, stress test the numbers, then weigh the 5 key rewards and 2 important warning signs.
Looking for more Warehouses De Pauw style investment ideas?
If Warehouses De Pauw has you thinking harder about valuation, do not stop here. The next move could come from widening your opportunity set with a focused screener.
- Target resilient value by scanning a curated 189 high quality undervalued stocks that combine quality fundamentals with potentially appealing prices.
- Prioritise staying power by zeroing in on a list of solid balance sheet and fundamentals (194 results) that can better handle tough conditions.
- Spot tomorrow's stories early by tracking a tight 619 high quality undiscovered gems that the broader market may not be watching yet.
This article by Simply Wall St is general in nature. We provide commentary based on historical data and analyst forecasts only using an unbiased methodology and our articles are not intended to be financial advice. It does not constitute a recommendation to buy or sell any stock, and does not take account of your objectives, or your financial situation. We aim to bring you long-term focused analysis driven by fundamental data. Note that our analysis may not factor in the latest price-sensitive company announcements or qualitative material. Simply Wall St has no position in any stocks mentioned.
Have feedback on this article? Concerned about the content? Get in touch with us directly. Alternatively, email editorial-team@simplywallst.com